14.9. Flow Chart
Below are examples of flow charts, but they are not necessarily applicable for every use-case and not necessarily the most
effective process for individual applications. For effective processing, user can do multiple execution, change ordering, eliminate
execution etc.
These flow should be optimization for suitable in each of system.
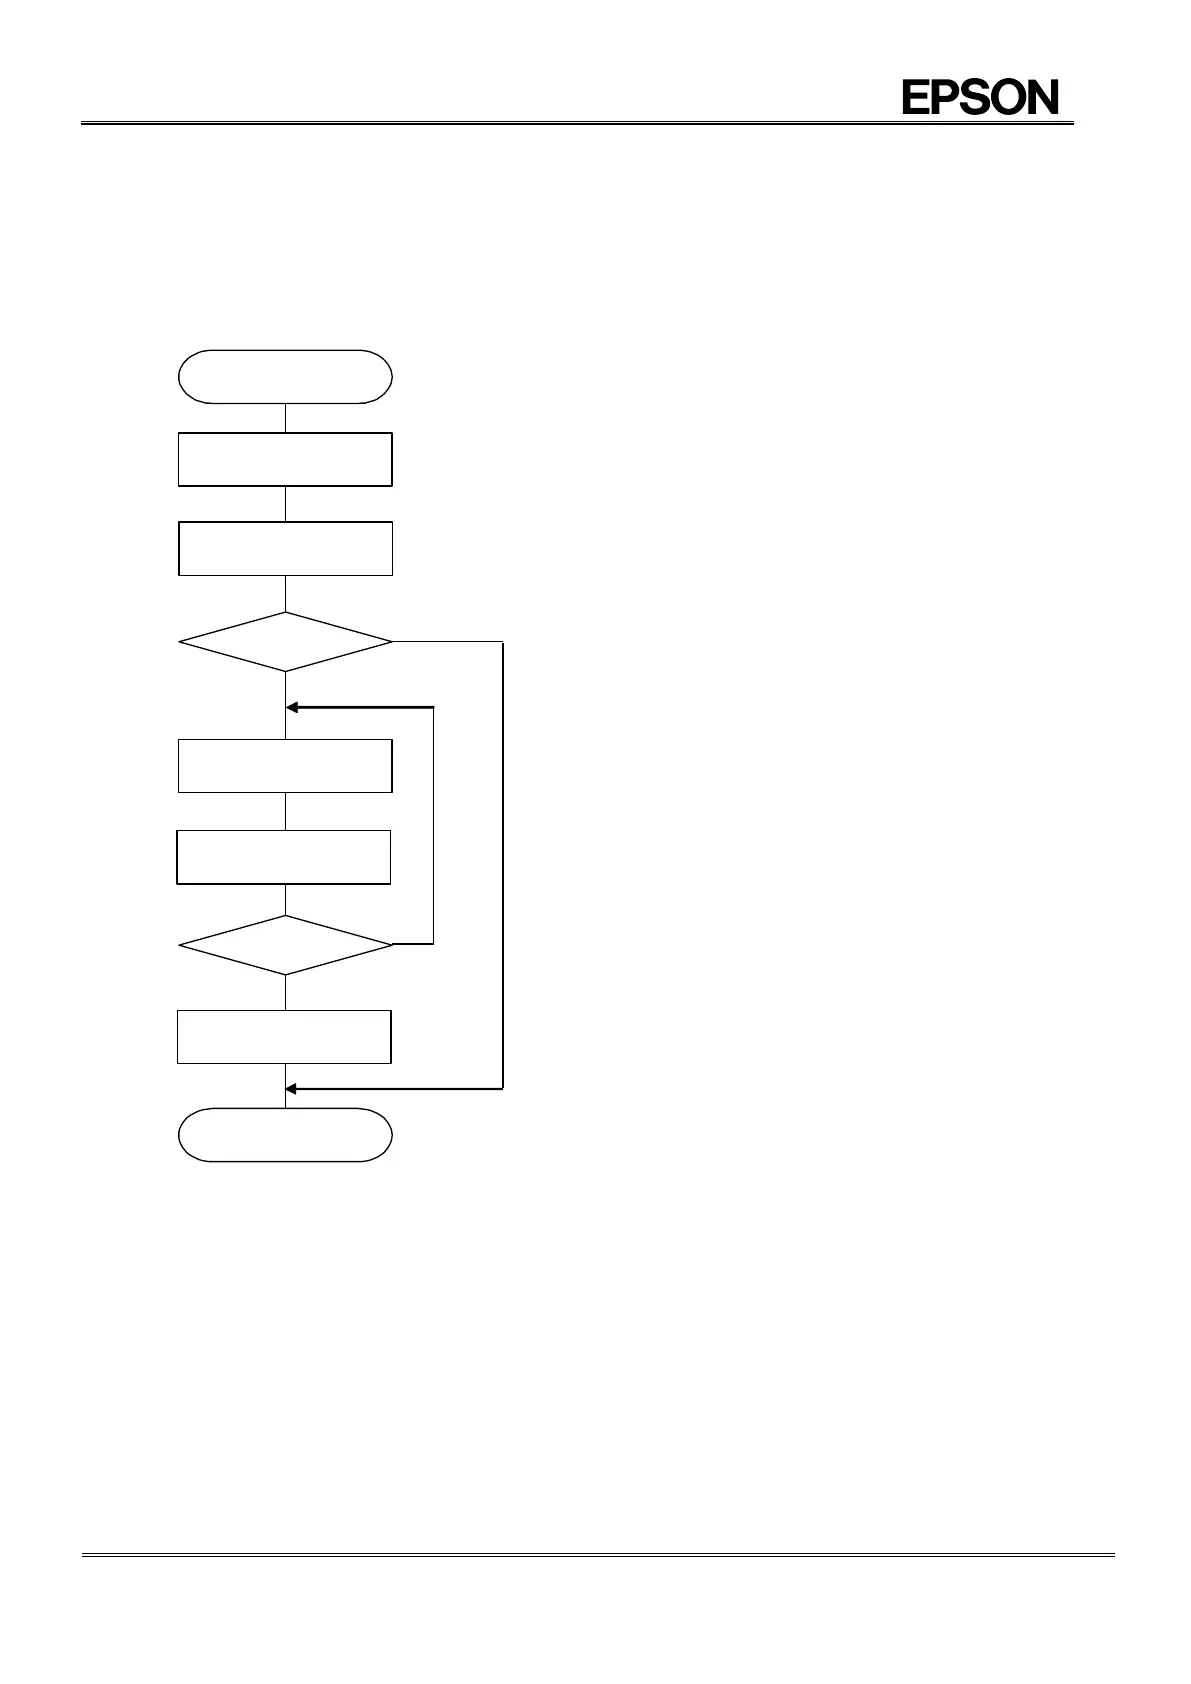
1) Power on initializing example
• After internal oscillation start VLF can be cleared to “0”.
• At least 40 ms wait time is needed.
So that it is stable RTC.
40 ms is not oscillation startup time.
• When RTC returned from battery backup normally, VLF is 0.
and after initial power On, VLF is 1.
• When VLF is 1, recommended initializing all register data.
• Waiting suitable time, in each of system.
more than 300 ms is recommended
Figure 38 Example flow (power on initialization)