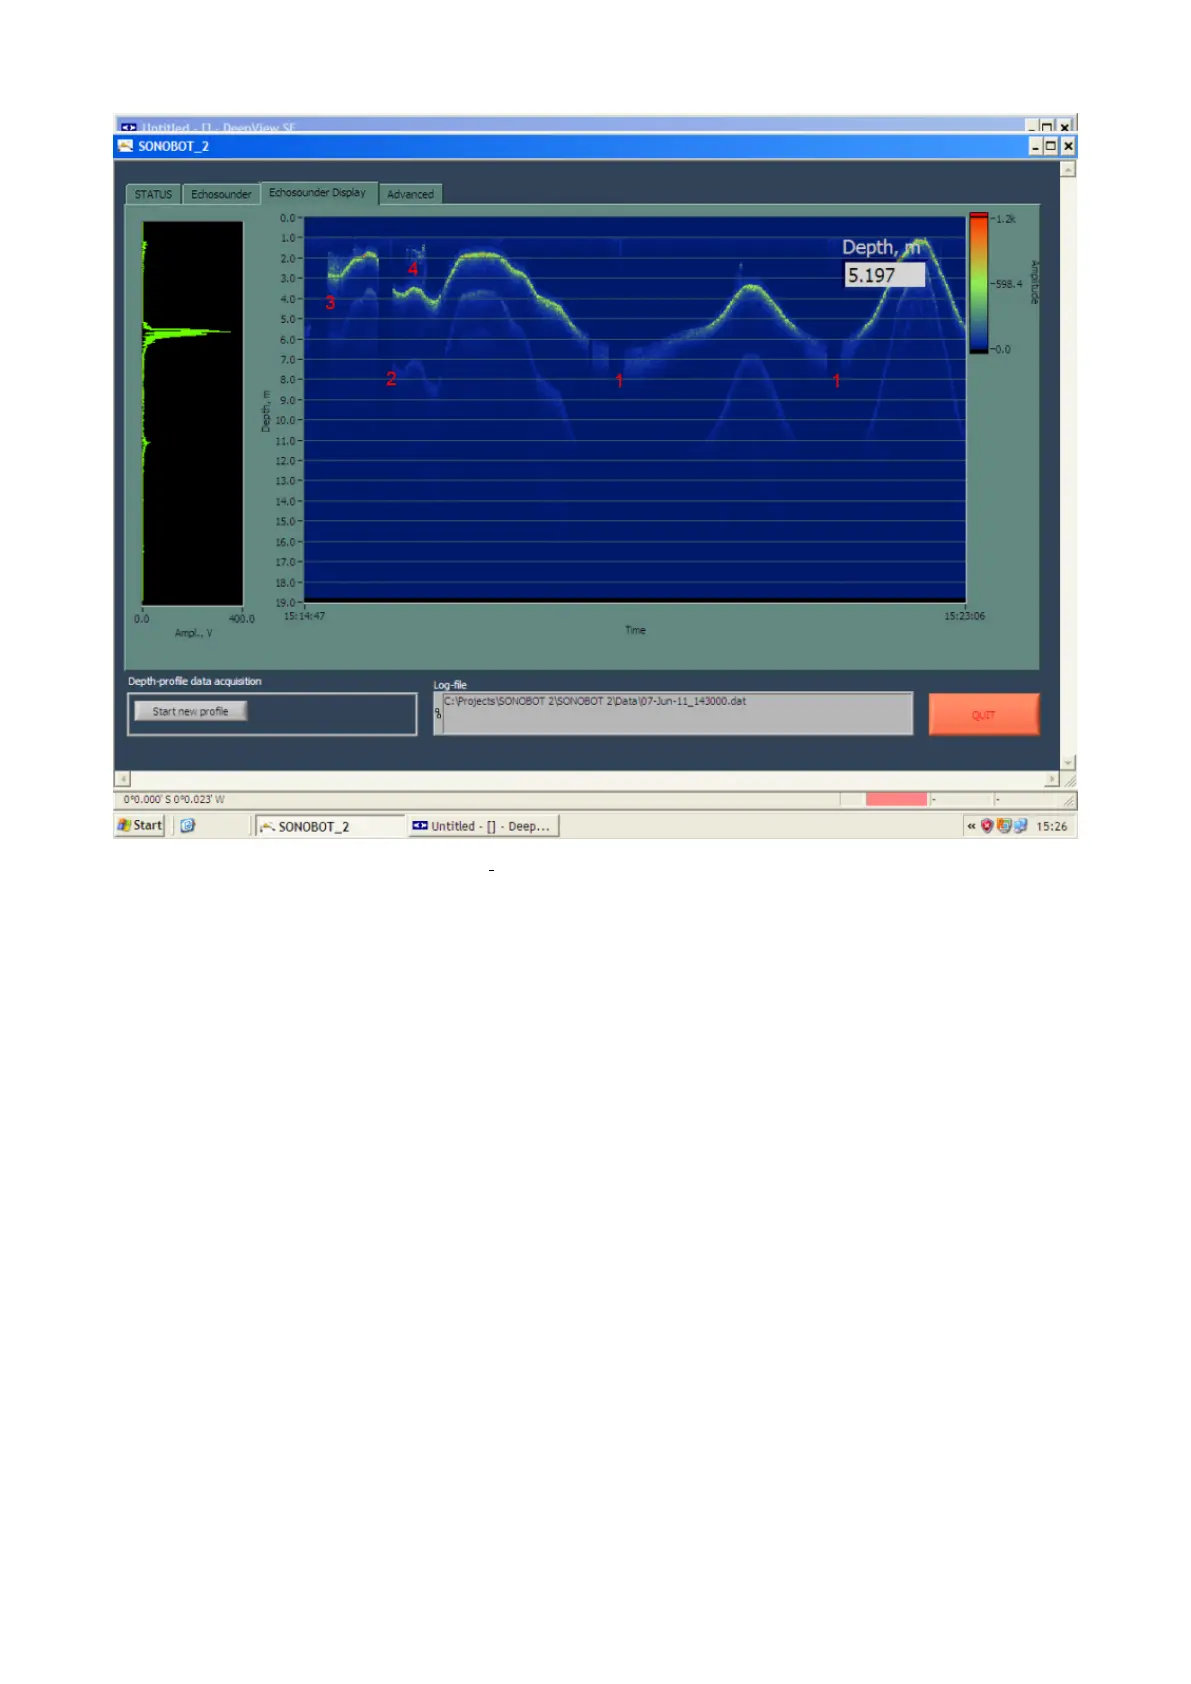
Figure 58: Sonobot 2: Echsounder Display tab - a depth profile example
The picture above is an example of a measured depth profile. A lake was surveyed by driving the vehicle back and forth
from the shore. The measurement results can be interpreted as following:
• The middle section of the profile shows the lake get deeper away from the shore.
• Above 6 m, the lake bottom is more solid, resulting in higher-density echo-signals.
• Below 6 m deep (1), the lake bottom is covered in sediments, so signal density is lower.
• Empty sections with missing data are caused by the vehicle’s fast turnarounds during the mission. Here air bubbles
under the echosounder obstruct depth measurements (1), as well as at (2), where the chosen propulsion speed was
too high.
• At (3), solid debris is found on the shallow lake bottom, as the echo-signal is very dense.
• At point (4) some fish can be recognized.
51
 Loading...