True-rms Digital Multimeters
Features
7
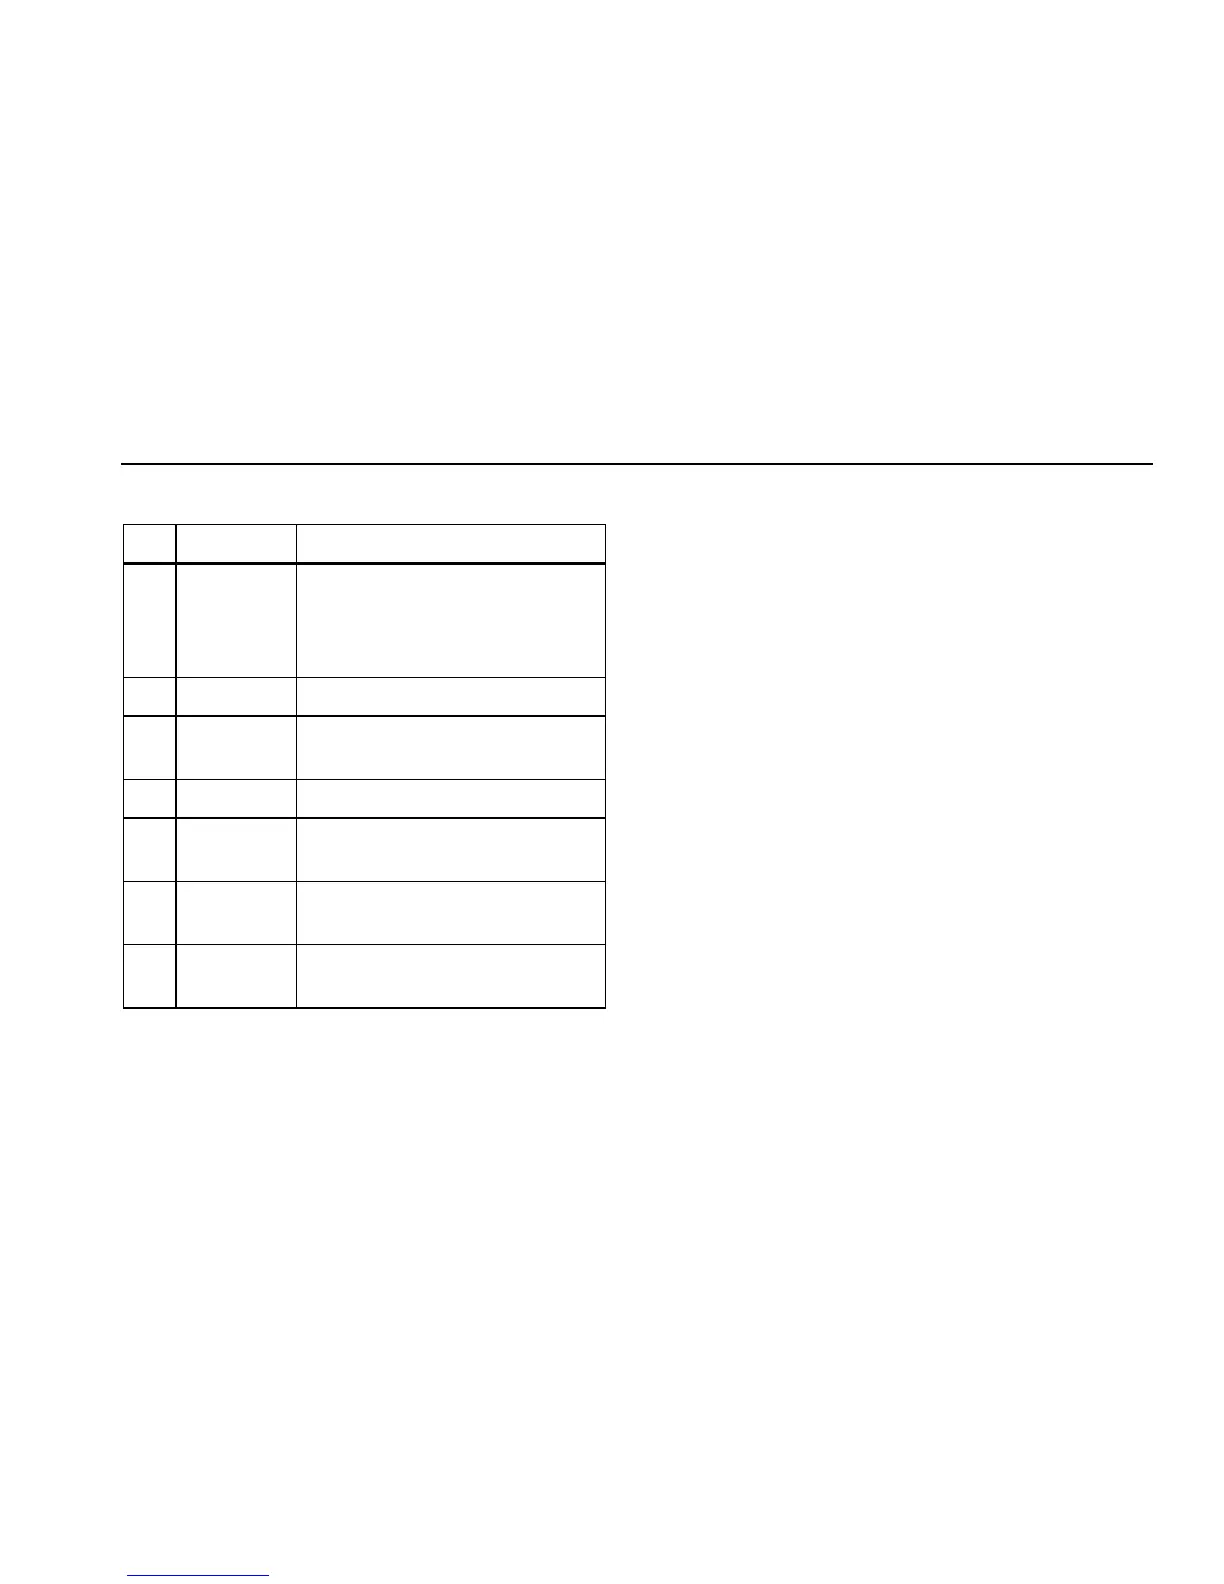
Table 3. Display Features (cont.)
Item Function Indication
J Mini-
measurement
Displays the lightning bolt (when necessary)
and the input value when the primary and
secondary displays are covered by a menu or
pop-up message.
K Date Indicates the date set in the internal clock.
L Beeper Indicates the Meter’s beeper is enabled (not
associated with the continuity beeper).
M Units Indicates the units of measure.
N Auxiliary Units Indicates unitless measurements like Crest
Factor.
O Range indicator Indicates the range the Meter is in and the
ranging mode (auto or manual).
P Secondary
display
Displays secondary measurement
information about the input signal.
Bar Graph
The analog bar graph functions like the needle on an analog meter, but
without the overshoot. The bar graph updates 30 times per second.
Because the graph updates faster than the digital display, it is useful for
making peak and null adjustments and observing rapidly changing
inputs. For frequency, duty cycle, pulse width, dBm, and crest factor
functions, the bar graph represents the amplitude of the input signal
(volts or amps) and not the value in the primary display. The bar graph is
not shown for capacitance, temperature, LoZ, AC+DC, AC over DC, peak,
or min max functions.
For dc voltage, dc current, and all relative percent modes, a zero-
centered bar graph is displayed. For dc voltage and current, the bar
graph range is the maximum of the selected range. For relative percent
mode, the bar graph goes to ±10 %.
The number of lit segments indicates the measured value and is relative
to the full-scale value of the selected range. In the 50 Vac range, for
example, the major divisions on the scale represent 0, 5, 10, 15, 20, 25,
30, 35, 40, 45, and 50 Vac. An input of 25 Vac turns on segments up to
the middle of the scale.
For off-scale values, f appears to the right of the normal bar graph. For
the zero-center bar graph, a e appears at the left end of the bar graph
for negative off-scale values and fappears on the right end for positive
off-scale values.
Adjusting Display Contrast
When not selecting items on a menu or inputting data, 7 increases
display contrast and 8 decreases it.
 Loading...