20 PB
SPECIFICATIONS
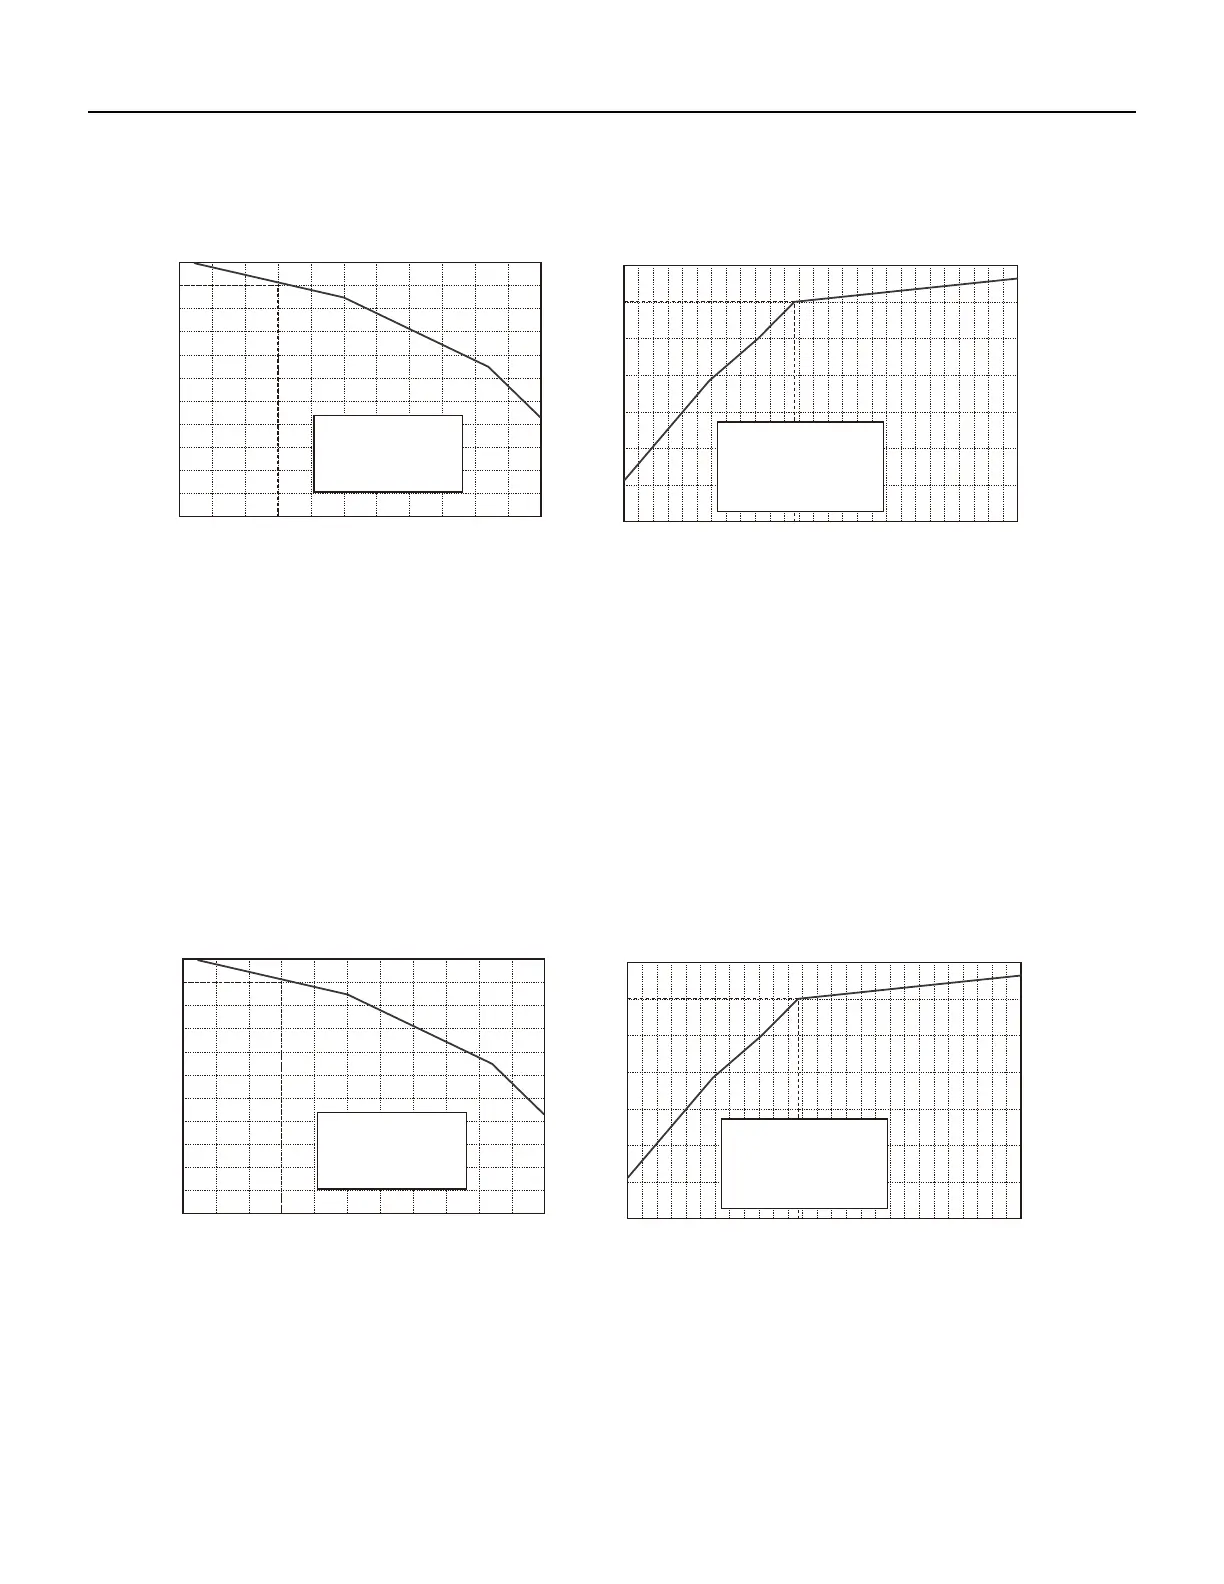
Figure 206
9-12K Capacity Variation Ratio According to Temperature
Figure 207
18-24 K Capacity Variation Ratio According to Temperature
Cooling Heating
5-4 41
110
100
90
80
70
60
50
40
23 32 41 50
Outdoor temp.(°F)
Capacity ratio (%)
100
105
95
90
85
80
75
70
65
89.6 91.4 93.2 95 96.8 98.6 100.4 102.2 104
105.8 107.6 109.4
60
55
50
Outdoor temp.(°F)
Capacity ratio (%)
Conditions
Outdoor:DB95°F
flow:Super HighIndoor air
Indoor:DB
80°F
/WB66.9
°F
Pipe length:
24.6ft
Conditions
Outdoor:DB19.94°F/WB19.04°F
Indoor:DB
70°F
air flow:SuperIndoor High
Pipe length:
24.6ft
Cooling
-4 5 41
110
100
90
80
70
60
50
40
23 32 41 50
Outdoor temp.(°F)
Capacity ratio (%)
100
105
95
90
85
80
75
70
65
60
55
50
Capacity ratio (%)
Outdoor:DB95°F
Indoor air flow:Super High
Conditions
Indoor:DB
80°F
/WB66.9
°F
89.6 91.4 93.2 95 96.8 98.6 100.4 102.2 104
105.8 107.6 109.4
Outdoor temp.(°F)
Pipe length:
24.6ft
Conditions
Indoor:DB
70°F
Outdoor:DB19.94°F/WB19.04°F
Indoor air flow:Super High
Pipe length:
24.6ft
Heating