45
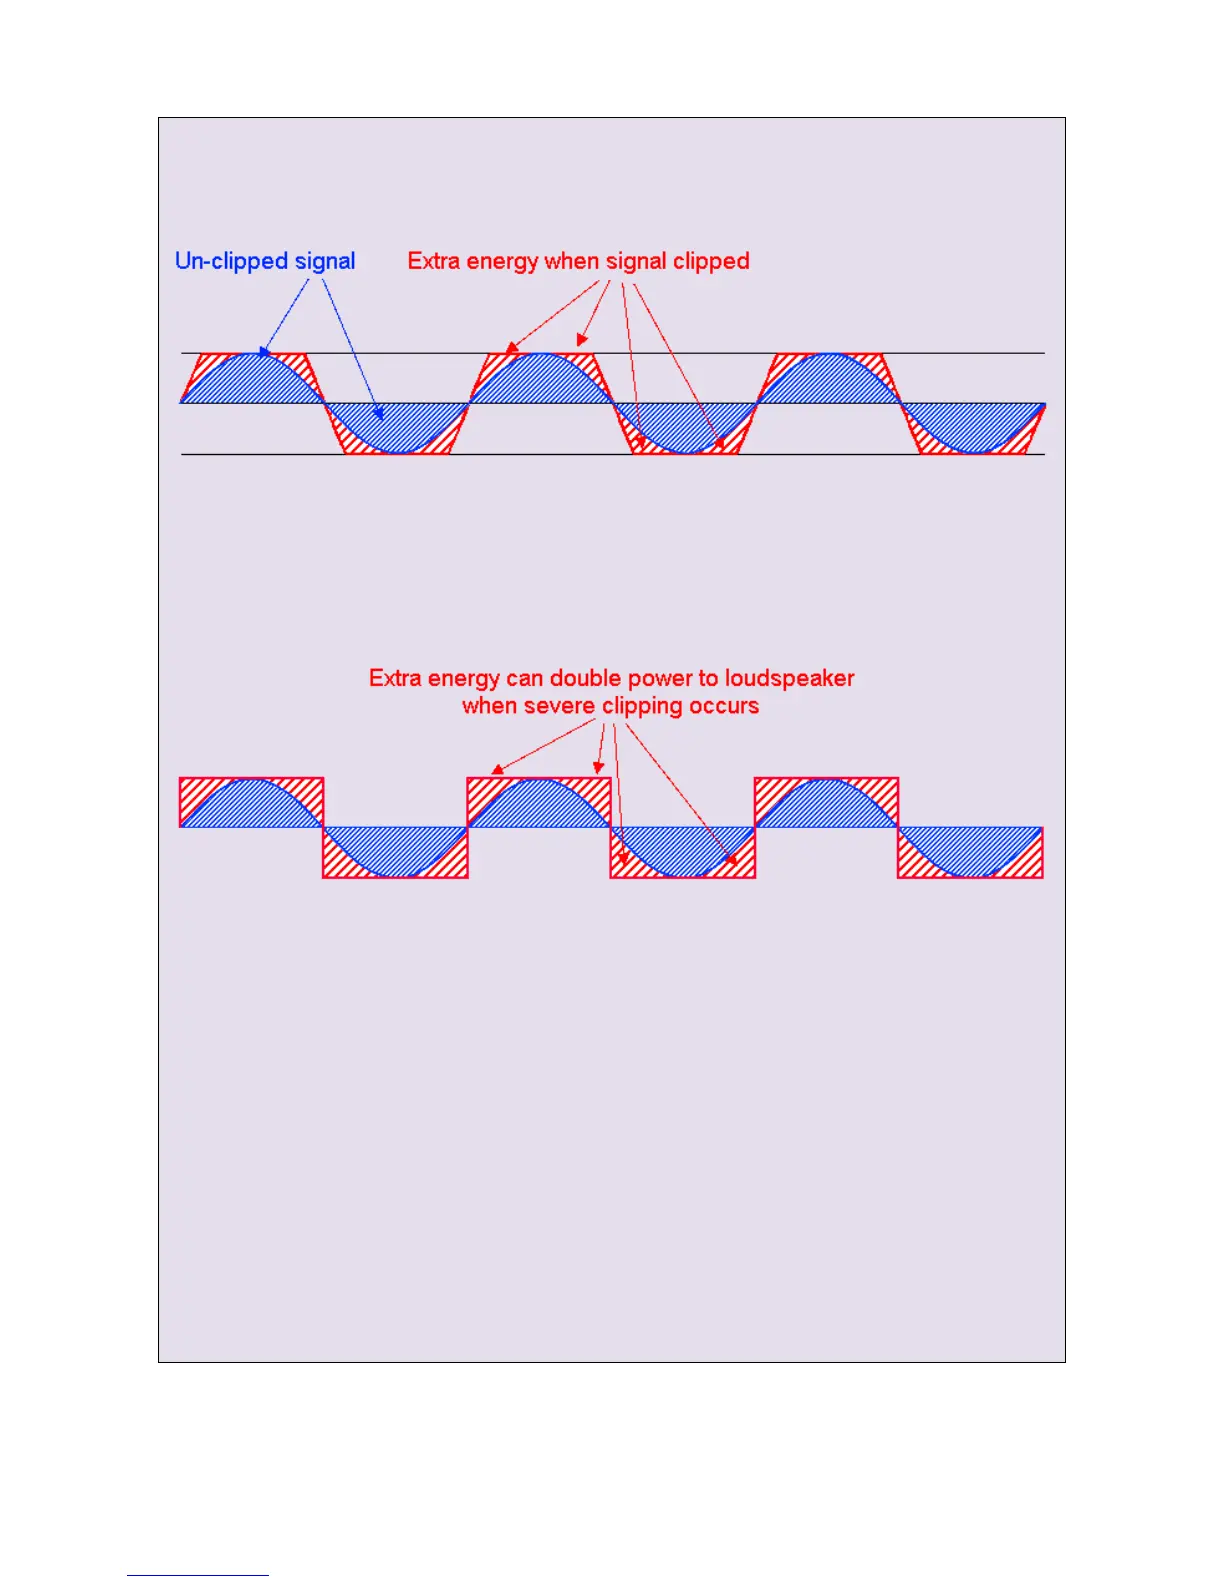
When a signal is clipped, its waveform squares off.
The cross-hatched areas cover a significantly larger area because the signal stays at the maximum
positive and negative values for more each cycle. This is easier to see if we overlay the normal and clipped
waveform illustrations. The clipped signal’s extra content can be seen as the extra red shaded areas.
Extra energy of a clipped signal
In extreme cases, the waveform is so heavily clipped that it can resemble a square wave. This increases
the rms voltage delivered to the loudspeaker to √2 (approx 1.4142) times what would be expected.
The power delivered to the loudspeaker is dependent on the rms voltage
2
.
√2 x √2 = 2 so the power delivered to your loudspeakers is doubled!
Note that, in all cases, the two waveforms have similar peak voltage levels so this extra energy doesn’t
always show up on digital audio systems where meters are usually calibrated with respect to maximum
digital level (full scale). This is usually written as dBFS.
Digital level meters don’t usually take the shape of the waveform (and its potential voice coil heating
effect!) into account - hence the warning at the beginning of this Appendix.
To avoid overheating loudspeaker voice coils – particularly HF voice coils in passive loudspeaker
systems – try not to clip signals repeatedly or for long periods.
Clipping and its effect on frequency content
All waveforms are made up of combinations of fundamental frequencies (main tones) and harmonics
(multiples of the fundamental frequencies, also known as overtones) in a variety of amplitude and phase
relationships.
Spectrum analysers can be used to show this. In the screen shot below, an unclipped pure tone
(approximately 1kHz) can be seen as a single frequency line.
www.funktion-one.com © Funktion One Research Limited 2011