2. DISPLAY CATEGORIES AND CATEGORY SPECIFIC MENUS
2-4
2.4 Graph Category
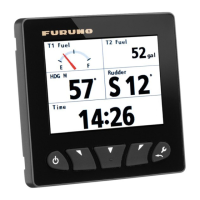
The graph category displays preselected sensor data in graph format. Up to two
graphs can be displayed simultaneously. The following data may be selected for
display in graph format.
The menu items displayed for the Graph category are dependent on the currently
graphed items. In the above right example, the menu will display [Depth Graph] and
[A Press Graph]. To adjust the graphed interval and range, see the procedure below.
To set the graph data to be displayed, see "How to set up pages" on page 1-6.
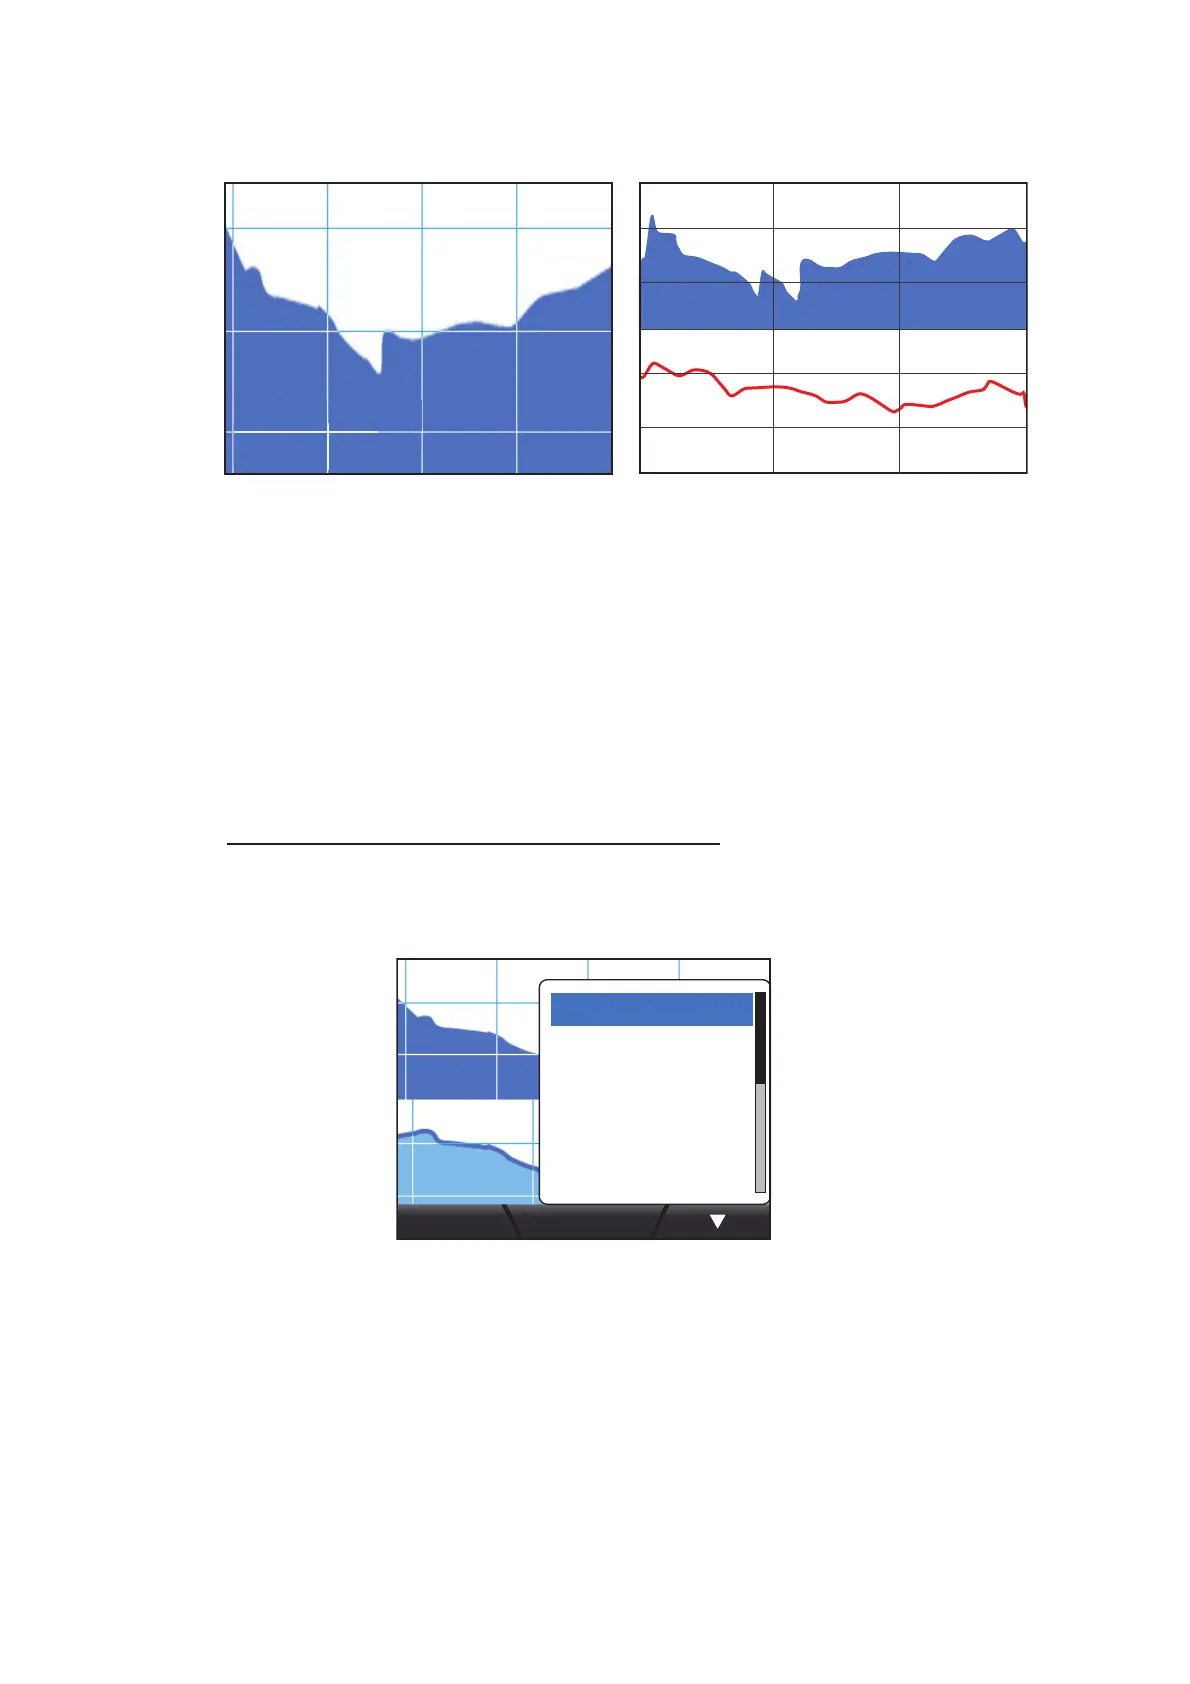
How to adjust the graphed interval and range
The graphed interval and range may be adjusted for all graphs.
1. With the [Graph] page displayed, press the Menu/Back key.
2. Press the software keys to select the graph to adjust, then press the function
key.
3. Press the software keys to select the appropriate variable to change.
[Period]: Adjusts the graphed interval.
[Range]: Adjusts the graphed range.
4. Using the software keys, adjust the [Period] and [Range] appropriately. Press the
function key to save the adjustments.
5. Press the Menu/Back key to close the menu.
• Depth
• W Temp. (Water temperature)
• A Temp. (Atmospheric temperature)
• A Press. (Atmospheric pressure)
DepthDepth
45004500
44004400
43004300
1010202030min30min
ftft
43034303
44004400
10001000
990990
43004300
DepthDepth
ftft
42564256
A Press.A Press.
hPahPa
10031003
1010202030min30min
30min30min
1010
2020
44004400
10001000
990990
43004300
DepthDepth
ftft
42564256
A PressA Press
HPaHPa
10031003
1010202030min30min
60min60min 3030
Ent
Depth Graph
A Press Graph
Disp Config
Alarms
 Loading...