Garmin aera 795/796 Pilot’s Guide
190-01194-00 Rev. C
94
Hazard Avoidance
OverviewGPS NavigationFlight PlanningHazard AvoidanceAdditional FeaturesAppendicesIndex
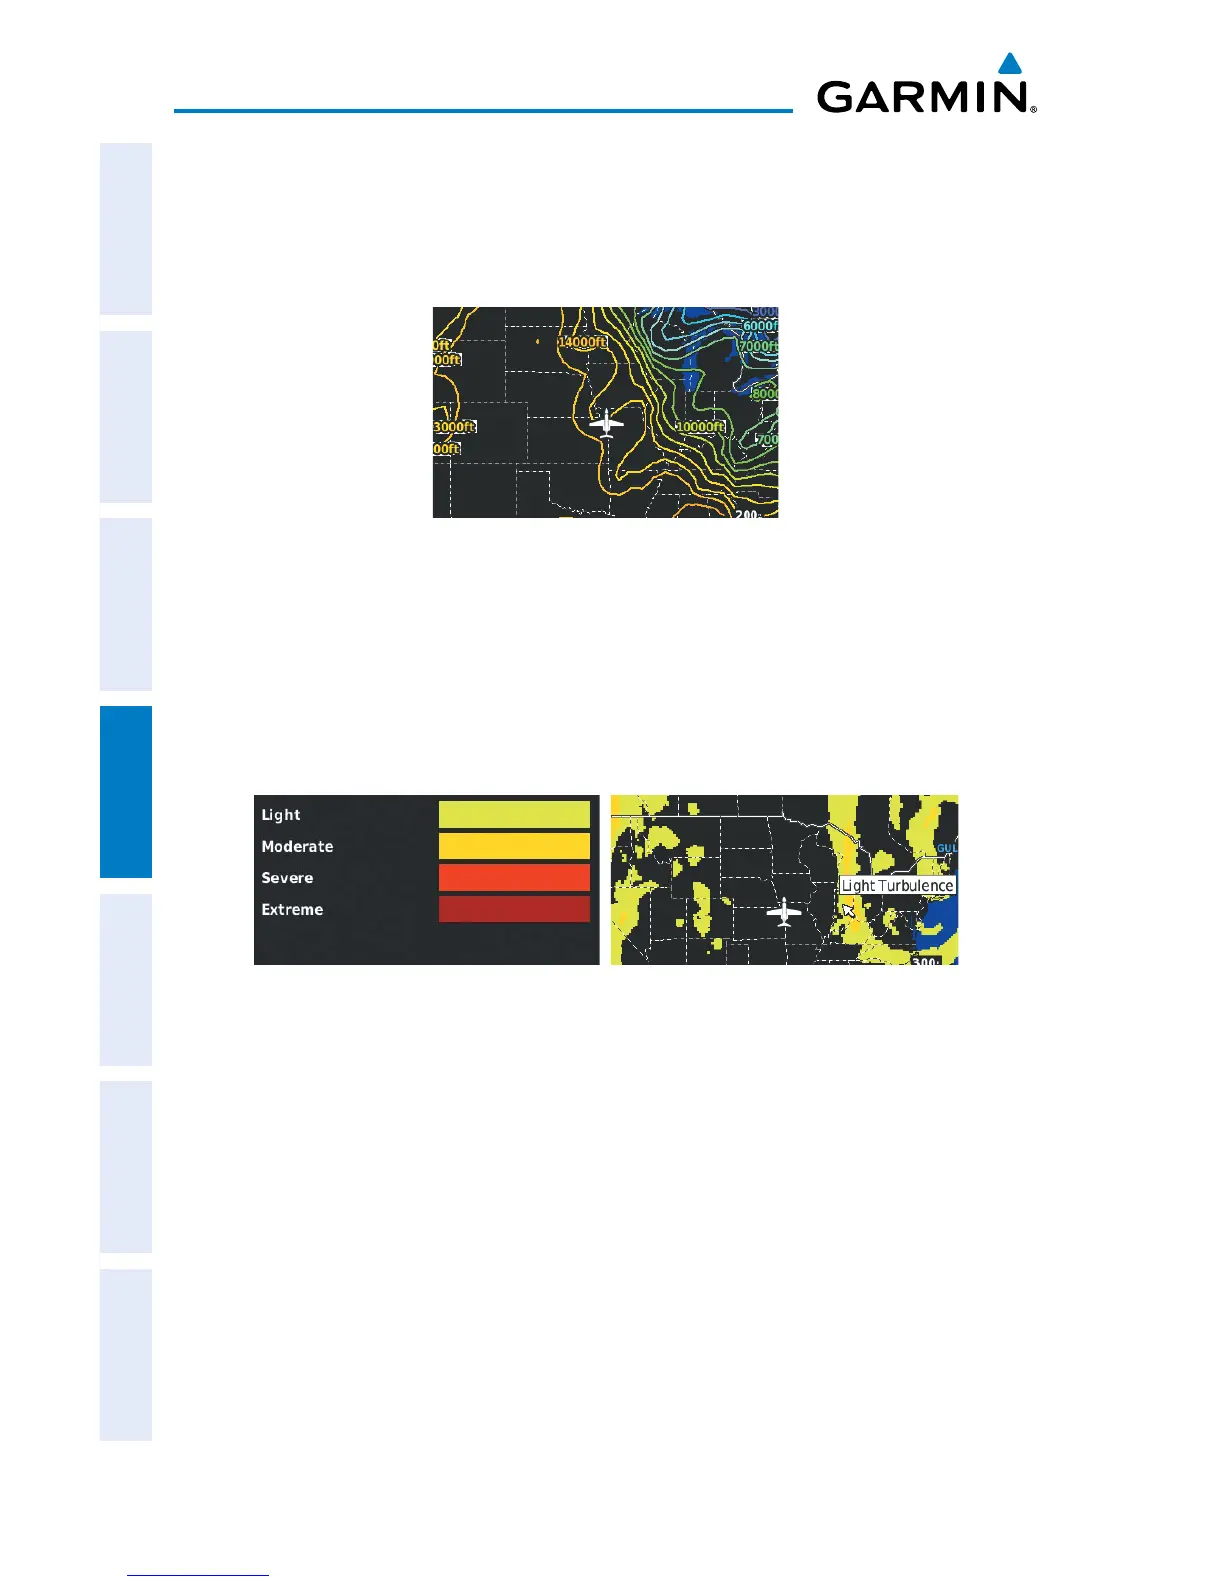
FREEZING LEVEL
Freezing Level shows contours for the lowest forecast altitude where icing conditions
are likely to occur.
Freezing Level Data
TURBULENCE FORECAST
Turbulence data identifies the potential for erratic movement of high-altitude air
mass associated winds. Turbulence is classified as light, moderate, severe, or extreme.
Turbulence data is intended to supplement AIRMETs and SIGMETs.
Turbulence Forecast Legend Light Turbulence Selected
ICING FORECAST (CIP & SLD)
Current Icing Product (CIP) data shows a graphical view of the current icing
environment. Icing severity is displayed in four categories: light, moderate, severe,
and extreme (not specific to aircraft type). The CIP product is not a forecast, but a
representation of the current conditions at the time of the analysis.
Supercooled Large Droplet (SLD) icing conditions are characterized by the presence
of relatively large, super cooled water droplets indicative of freezing drizzle and
freezing rain aloft. SLD threat areas are depicted as magenta dots over the CIP colors.
 Loading...