• To use data from both a connected heading sensor and
the GPS antenna, select
COG and Heading.
This displays both the heading line and the COG line on
the chart.
3
Select
Display, and select an option:
• Select Distance
> Distance
, and enter the length of the
line shown on the chart.
• Select Time
> Time
, and enter the time used to calculate
the distance your boat will travel in the specified time at
your present speed.
Waypoints and Tracks Settings on the Charts and
Chart Views
From a chart or a 3D chart view, select MENU > Waypoints &
Tracks.
Tracks: Shows tracks on the chart or 3D chart view.
Waypoints: Shows the list of waypoints (Viewing a List of all
Waypoints, page 14).
Create Waypoint: Creates a new waypoint.
Waypoint Display: Sets how to display waypoints on the chart.
Active Tracks: Shows the active track options menu.
Saved Tracks: Shows the list of saved tracks (Viewing a List of
Saved Tracks, page 17).
Tracks Display: Sets which tracks to display on the chart based
on track color.
Other Vessels Settings on the Charts and Chart Views
NOTE:
These options require connected accessories, such as
an AIS receiver or VHF radio.
From a chart or 3D chart view, select
MENU
> Other Vessels
.
AIS List: Shows the AIS list (Viewing a List of AIS Threats,
page 8).
DSC List: Shows the DSC list (DSC List
, page
30).
AIS Display Setup: See AIS Display Settings, page 10.
DSC Trails: Shows the tracks of DSC vessels, and selects the
length of the track that appears using a trail.
AIS Alarm: Sets the safe-zone collision alarm (Setting the Safe-
Zone Collision Alarm, page 8).
AIS Display Settings
NOTE:
AIS requires the use of an external AIS device and
active transponder signals from other vessels.
From a chart or 3D chart view, select
MENU
> Other Vessels >
AIS Display Setup
.
AIS Display Range: Indicates the distance from your location
within which AIS vessels appear.
Details: Shows details about AIS-activated vessels.
Projected Heading: Sets the projected heading time for AIS-
activated vessels.
Trails: Shows the tracks of AIS vessels, and select the length of
the track that appears using a trail.
Laylines Settings
To use the laylines features, you must connect a wind sensor to
the chartplotter.
When in sailing mode (Setting the Vessel Type, page 3), you
can display laylines on the navigation chart. Laylines can be
very helpful when racing.
From the navigation chart, select MENU
> Laylines
.
Display: Sets how the laylines and vessel appear on the chart,
and sets the length of the laylines.
Sailing Angle: Allows you to select how the device calculates
laylines. The
Actual option calculates the laylines using the
measured wind angle from the wind sensor. The Manual
option calculates the laylines using manually entered
windward and leeward angles.
Windward Angle: Allows you to set a layline based on the
windward sailing angle.
Leeward Angle: Allows you to set a layline based on the
leeward sailing angle.
Tide Correction: Corrects the laylines based on the tide.
Filter Time Constant: Filters the layline data based on the time
interval entered. For a smoother layline that filters out some
of the changes in the boat's heading or true wind angle, enter
a higher number. For laylines that display a higher sensitivity
to changes in the boat's heading or true wind angle, enter a
lower number.
Fish Eye 3D Settings
NOTE: This feature is available with premium charts, in some
areas.
From the Fish Eye 3D chart view, select
MENU.
View: Sets the perspective of the 3D chart view.
Tracks: Shows tracks.
Sonar Cone: Shows a cone that indicates the area covered by
the transducer.
Fish Symbols: Shows suspended targets.
Supported Maps
To help you have a safe and enjoyable time on the water,
Garmin
devices only support official maps produced by Garmin
or an approved third party producer.
You can purchase maps from Garmin. If you purchase maps
from a seller other than Garmin, investigate the seller before
purchasing. Be extra cautious with online sellers. If you have
purchased an unsupported map, return it to the seller.
Garmin Quickdraw Contours Mapping
WARNING
The
Garmin Quickdraw Contours mapping feature allows users
to generate maps. Garmin makes no representations about the
accuracy, reliability, completeness or timeliness of the maps
generated by third parties. Any use or reliance on the maps
generated by third parties is at your own risk.
The
Garmin Quickdraw Contours mapping feature allows you to
instantly create maps with contours and depth labels for any
body of water.
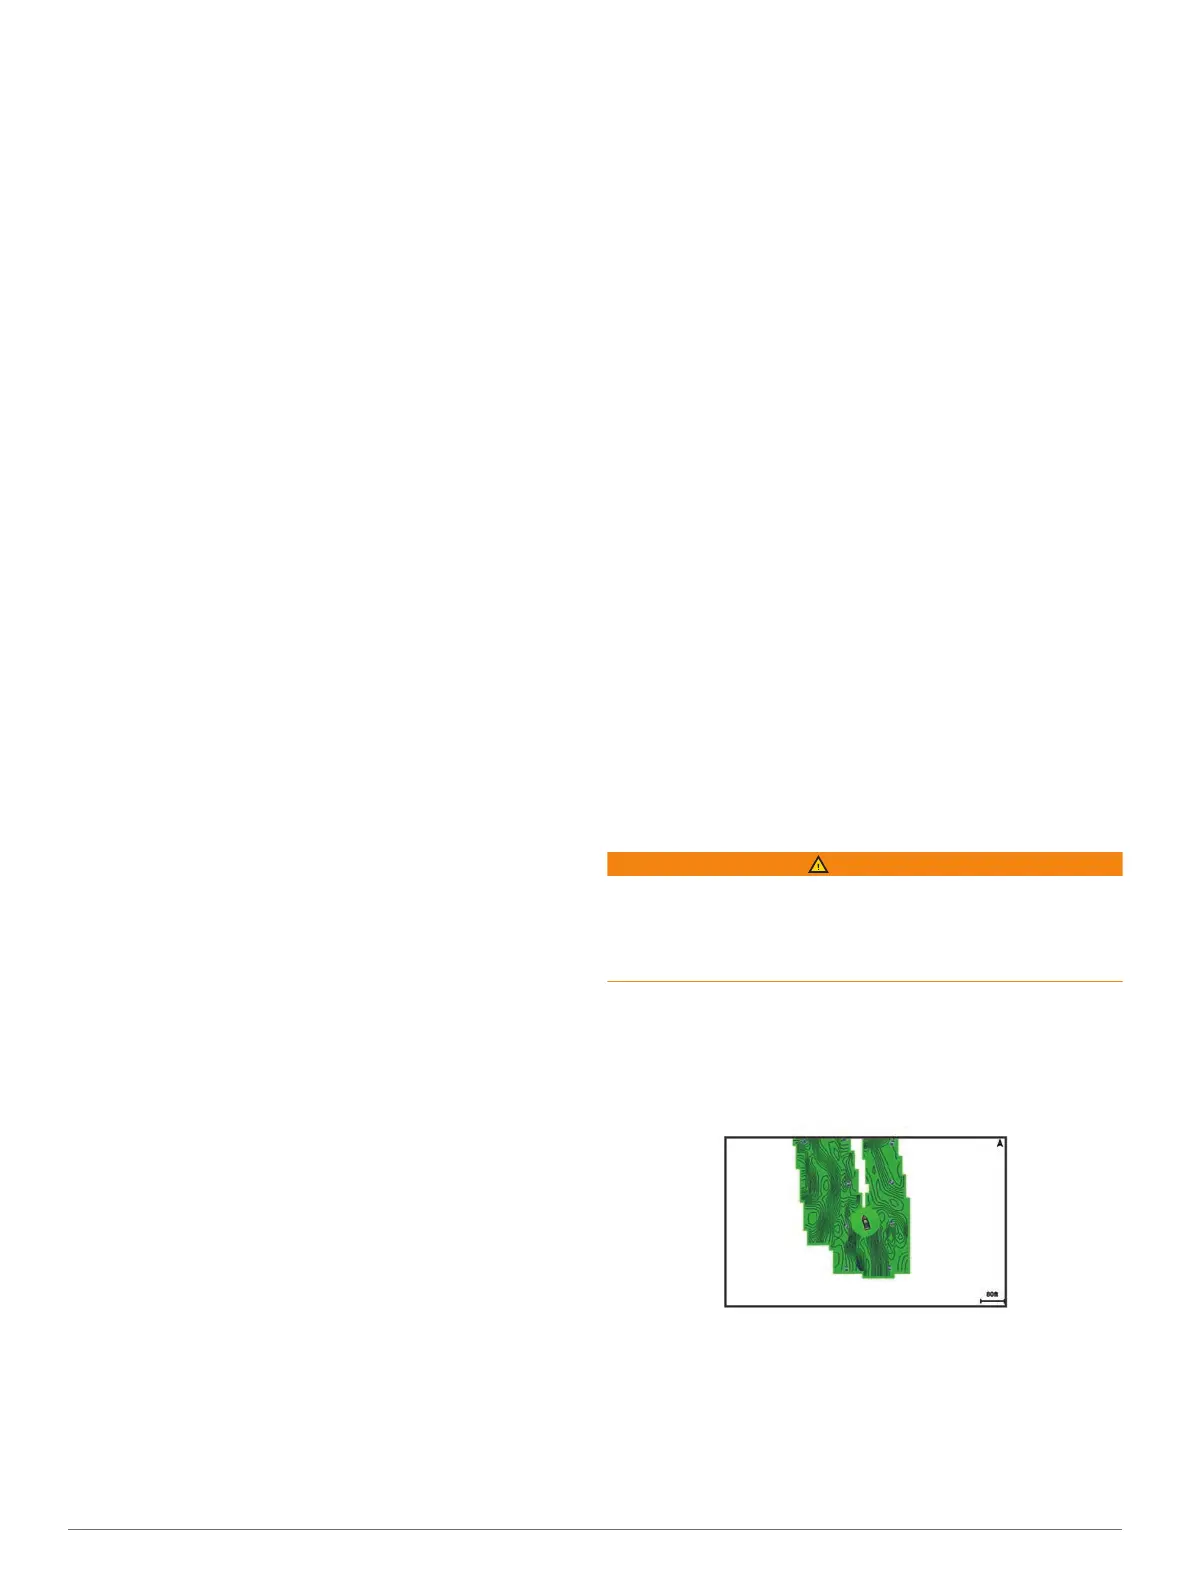
When Garmin Quickdraw Contours records data, a colored
circle surrounds the vessel icon. This circle represents the
approximate area of the map that is scanned by each pass.
A green circle indicates good depth and GPS position, and a
speed under 16 km/h (10 mph). A yellow circle indicates good
depth and GPS position, and a speed between 16 and 32 km/h
(10 and 20 mph). A red circle indicates poor depth or GPS
position, and a speed above 32 km/h (20 mph).
You can view Garmin Quickdraw Contours in a combination
screen or as a single view on the map.
10 Garmin Quickdraw
Contours Mapping
 Loading...