User Programs—Customized Analysis
User Programs—Customized Analysis
Page 40
5940018UserPrograms.fm
4. After entering the Program Name, save the program by touching
Save Program. Once the rest of the data in the table above is entered, touch
Save Program again, then touch Done. The program is now in the list of
User Programs.
5.1.1 Entering a Calibration Formula Directly
1. Scroll to Calibration and touch Edit.
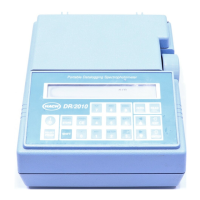
5.1.2 Creating a Calibration Table
The Curve Fit screen allows concentration values to be entered and
the corresponding absorbance values to be read. After selecting the curve type,
the instrument will calculate the coefficients of the formula, based on the points
in the table.
6. When the first calibration standard is ready to read, insert it in the sample
compartment. Touch
Read to read the absorbance and capture the first point
on the calibration curve.
7. Touch the
Add Point icon again.
8. Enter the second calibration point concentration. Touch
OK.
9. Insert the second calibration standard. Touch
Read to read the absorbance.
10. Continue this process until all the standards are read (up to a maximum of
16 points).
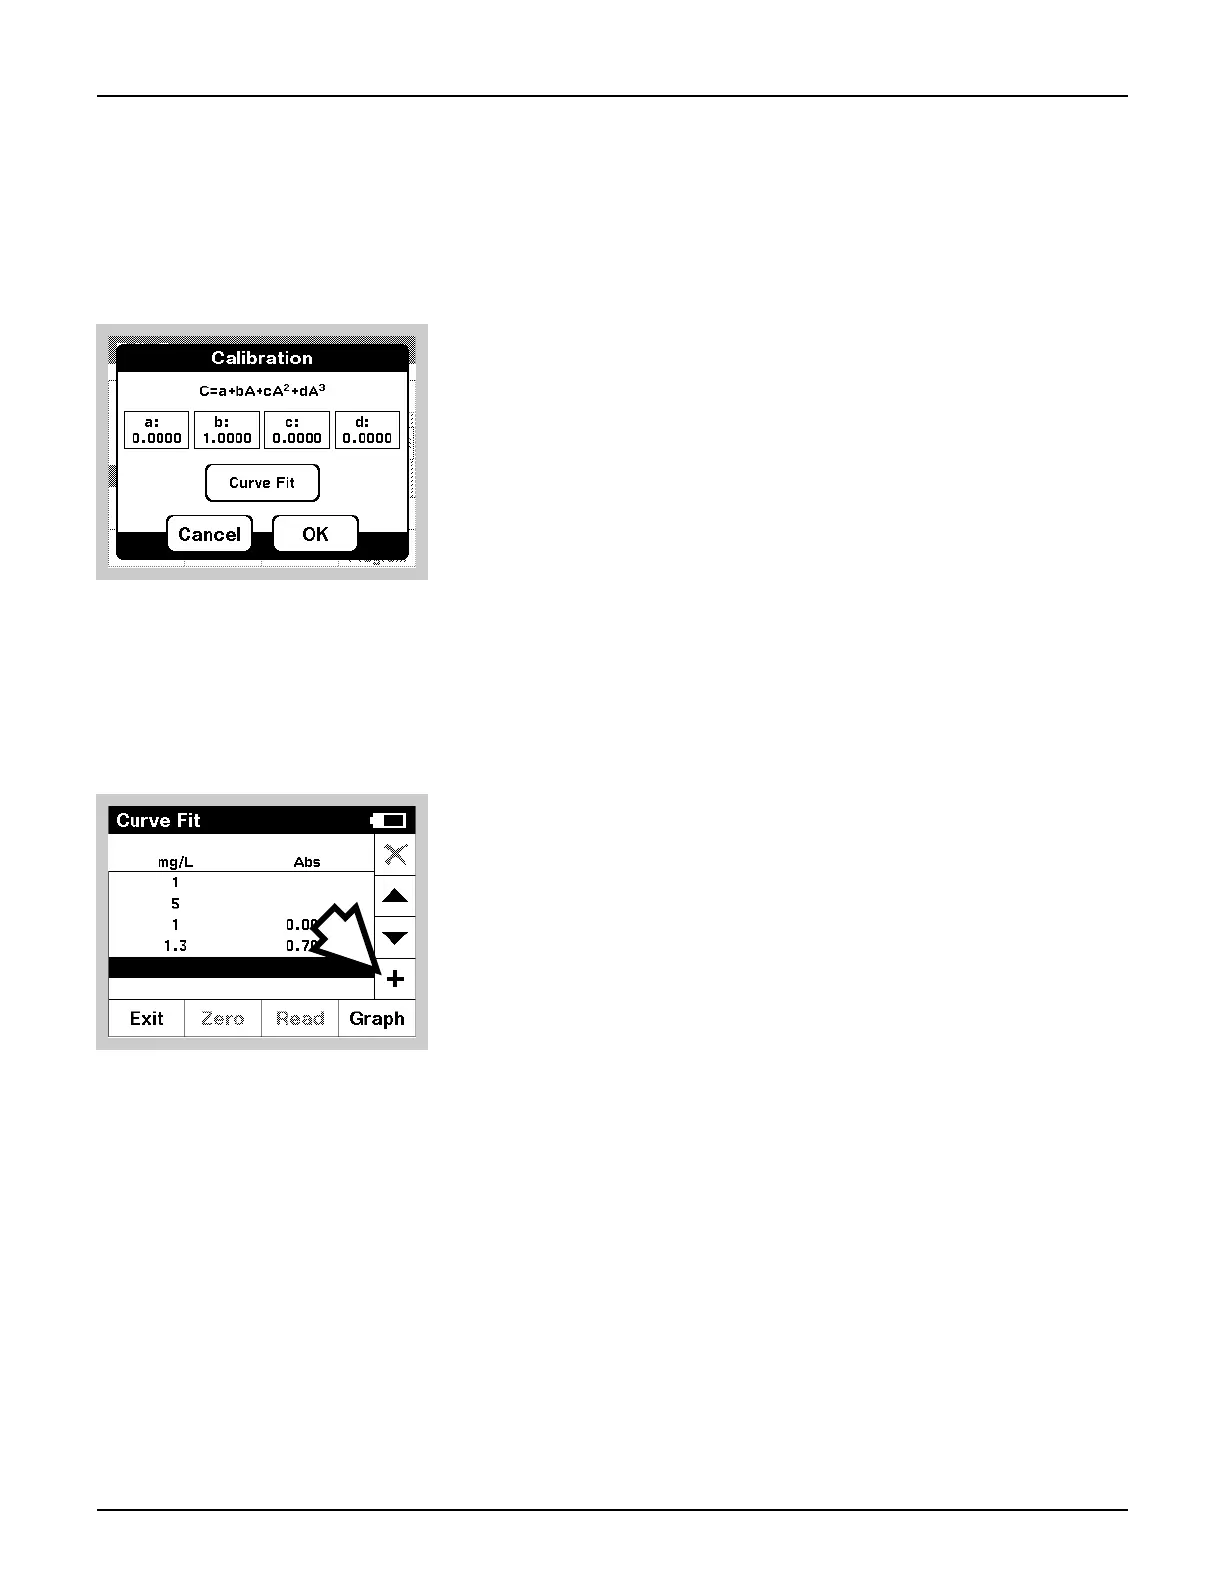
2. Touch and edit each of the coefficients to complete the formula.
The coefficients determine the complexity of the formula. For
example, a simple linear relationship would have coefficients of
zero for c and d.
The Calibration screen shows the formula that will be used to
calculate concentration. This formula is shown at the top of the
screen. “C” stands for the calculated concentration. The “A”
corresponds to the absorbance reading, and the lowercase
characters “a”, “b”, “c”, and “d” correspond to the coefficients
in the formula.
1. On the Edit User Program screen, highlight Calibration and
touch
Edit.
2. On the Calibration screen, touch
Curve Fit.
3. Touch
+ to add a point.
4. Enter the first Standard Concentration value. Touch
OK.
5. Insert a blank sample (not the first standard) and touch
Zero.