Standard Additions
Standard Additions
5940018StdAdd.fm Page 45
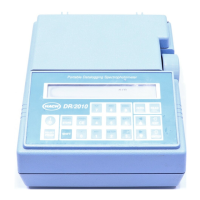
7. Analyze each sample spike as described in the procedure, starting with the
0.1-mL sample spike. Accept each standard additions reading by touching
Read. Each addition should reflect approximately 100% recovery.
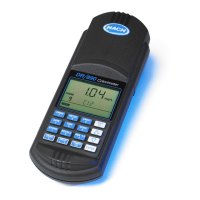
8. After completing the sequence, touch
Graph to view the best-fit line through
the standard additions data points, accounting for matrix interferences. The r
2
value gives an indication of how well the data points line up. The closer to
1.000, the more the data points have a linear relationship.
9. To view the relationship between the sample spikes and the “Ideal Line” of
100% recovery, touch
View, then select Ideal Line and OK.
6.3 Estimating Concentration Using Standard Additions
Even with a known interference, it may still be possible to estimate the
concentration of the analyte in the sample. The following steps will help estimate
the result:
1. Use the Standard Additions Method section under Accuracy Check in the
procedure to analyze the sample.
Below the plot is the calculated r
2
value. This is a measure of how well the data
plots as a line. If r
2
= 1.000, it is likely that 100% of the variation in the data is due
to the standard additions. If r
2
= 0.900, 90% of the variation in the data is due to
the standard additions. The other 10% is due to factors other than the additional
volume of standard.
5. Open a bottle of Aluminum Standard Solution, 50 mg/L Al
3+
.
6. Prepare three sample spikes. Fill three mixing cylinders (Cat. No.
1896-40) with 50 mL of sample. Use the TenSette™ Pipet to add
0.1 mL, 0.2 mL, and 0.3 mL of standard, respectively, to each
sample and mix thoroughly.
Note: Procedures using AccuVac
®
ampules require larger volumes. Refer to the
instructions in the Procedure Manual.
2. The display shows a plot of the data and a line that estimates the
concentration curve.
3. The estimated concentration of the original unspiked sample is
shown above the graph.
 Loading...