66
Advanced Operations
6.5.2 Time Course Scan Reading
After the parameters have been selected, the instrument must be
zeroed, then the sample can be analyzed.
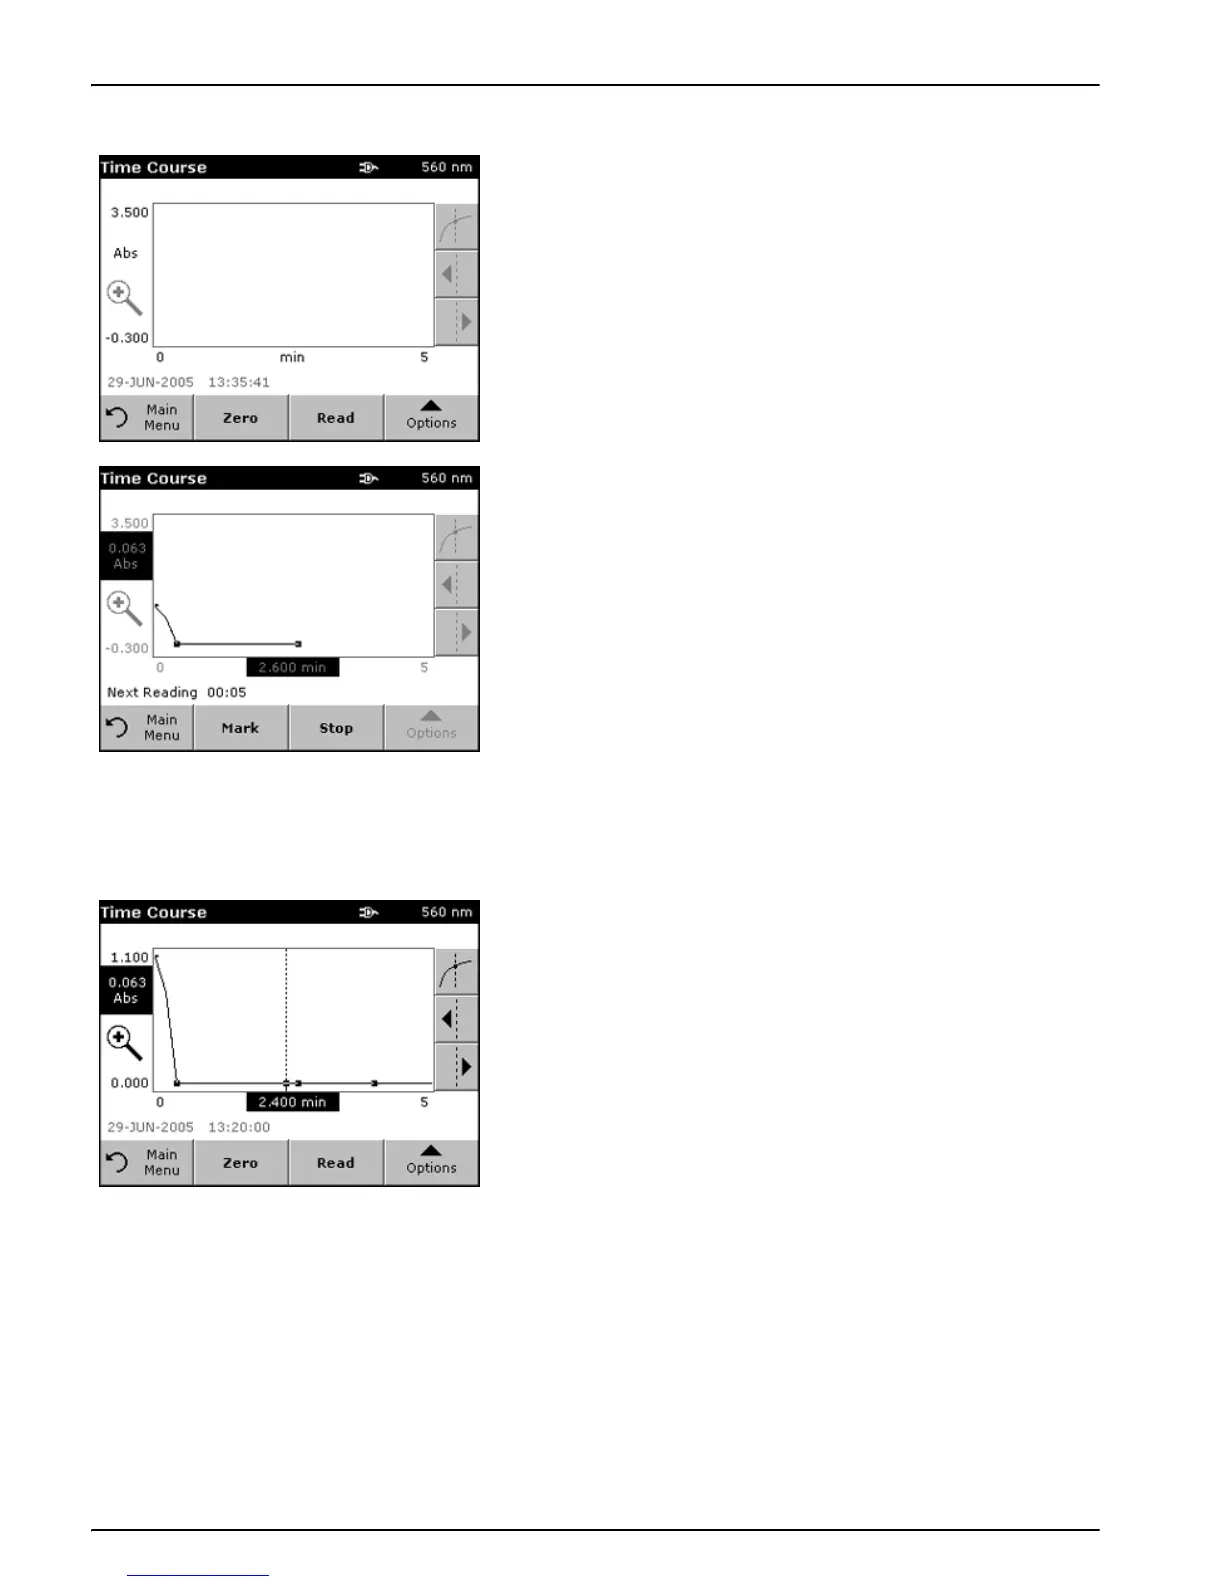
1. Insert the blank cell into the cell holder. Press
ZERO.
The blank reading is shown on the display.
2. Insert the sample cell into the cell holder. Press
READ.
Start collecting time course (kinetic) data.
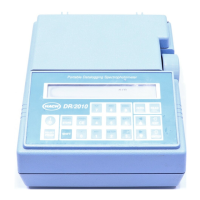
Note: During the measurement the ZERO and READ keys change to
MARK and STOP.
3. Select MARK to mark the next data point collected. This mark
may indicate a significant event, such as the addition of a
sample or other reagent. The mark is also shown in the table.
Select
STOP to stop taking the sample readings.
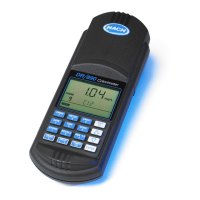
6.5.3 Analysis of Time Course Data
After the data are collected, the following manipulations can be
done on the graphic data:
The Time Course Program is complete, if
• the sound is activated, the instrument beeps when the readings
are done
• the graph is shown full size,
• the scaling of the x-axis occurs automatically,
• the Cursor functions in the vertical navigation bar are activated.
6.5.3.1 Navigating a Time Scan Graph or Analysis
After a time scan has been performed, the time and the
absorbance/transmittance data are displayed as a curve.