Network Camera User Manual
156
counting data from application tab. To get more intuitional results, you can display the
data in different charts.
Steps:
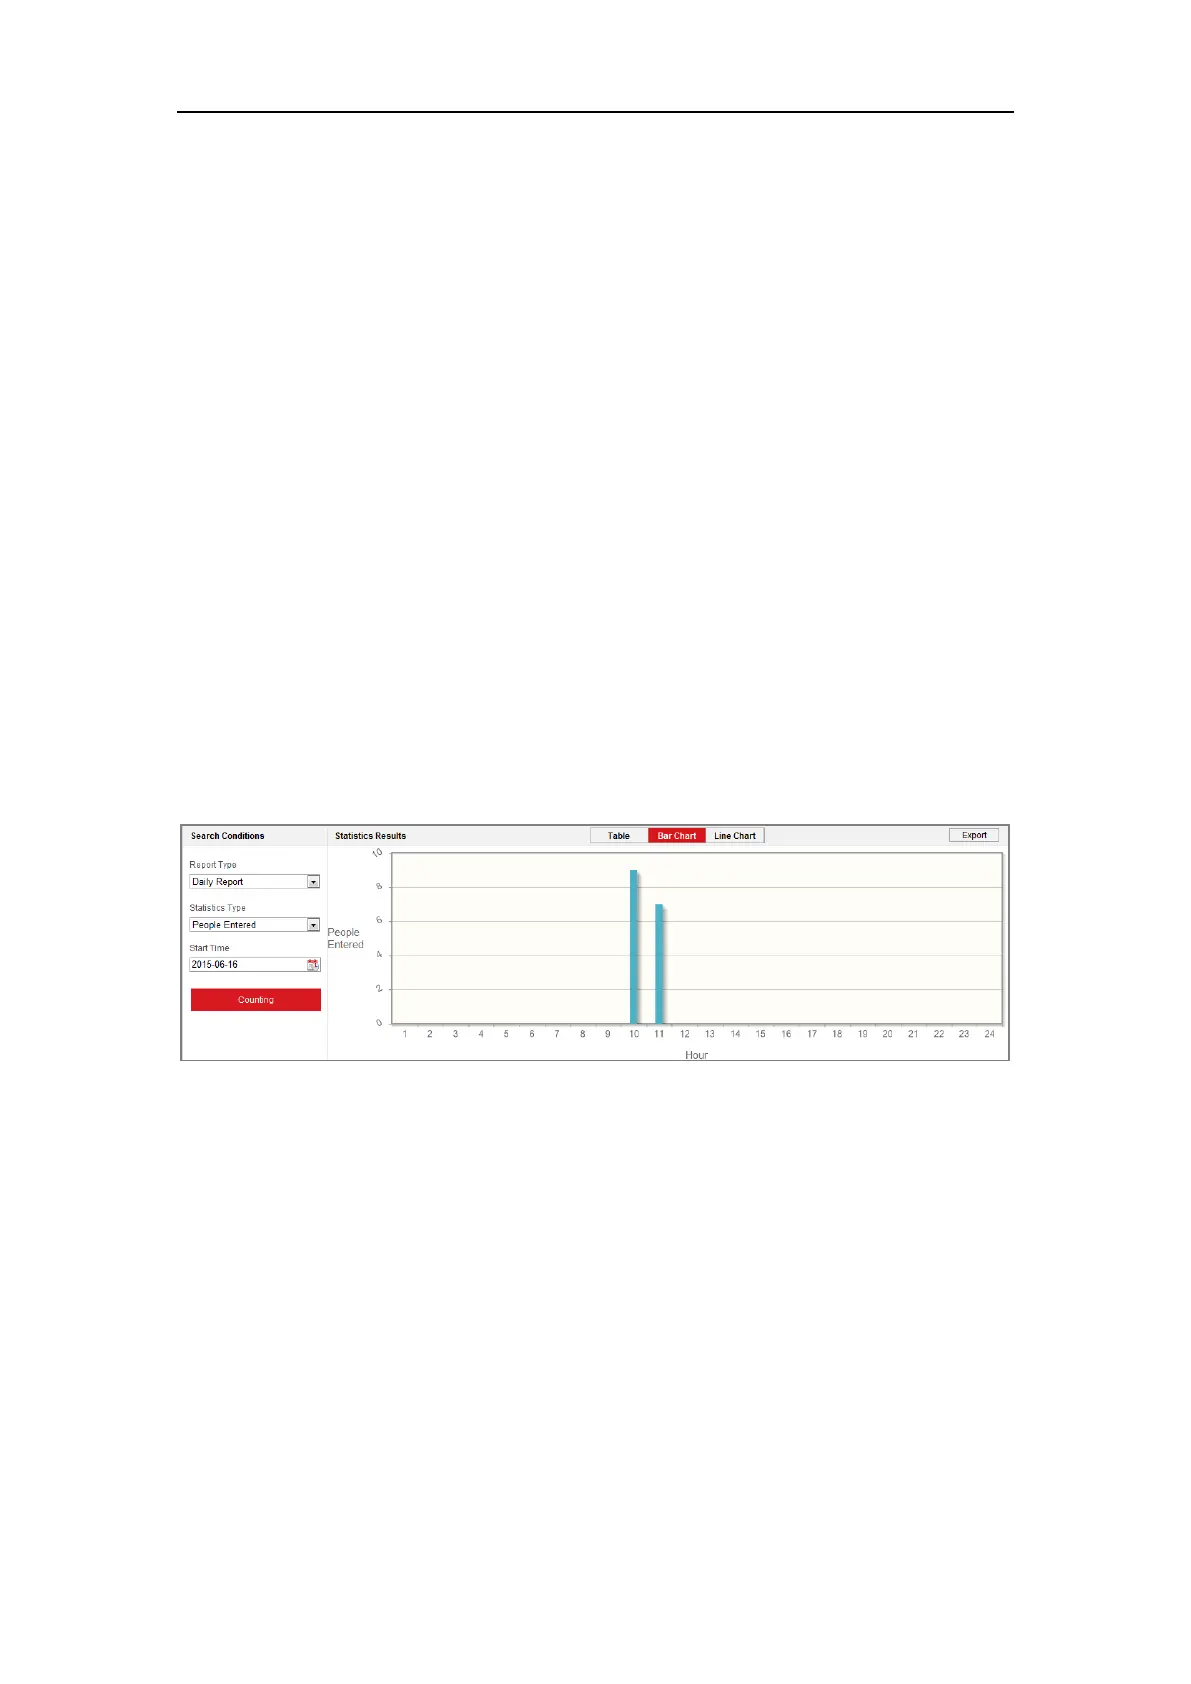
1. Select the report type. Daily report, weekly report, monthly report, and annual
report are selectable.
Note: Daily report calculates the data on the date you selected; weekly report
calculates for the week your selected date belongs to; monthly report calculates
for the month your selected date belongs to; and the annual report calculates for
the year your selected date belongs to.
2. Select the statistics type. People Entered, and People Exited are selectable.
3. Select the start time, and click Counting.
The counting result displays in the statistic result area. Click Table, Bar Chart, or
Line Chart to display the result in different way.
Note: If you select table to display the statistics, there is an Export button to
export the data in an excel file.
Figure 14-2 People Counting
14.3 Heat Map Statistics
After you enable the heat map function, you can view and download the heat map
data from application tab. To get more intuitional results, you can display the data in
different charts.
Steps:
1. Select the report type. Daily report, weekly report, monthly report, and annual
report are selectable.
 Loading...