• The ALARM output is activated (1).
• Depending on the LimitScaleVal setting, the OUTPUT value is assigned either the scaled limited
input value (LimitScaleVal = "Limit value" or "Limit value w/o alarm") or the configurable
DefValue (LimitScaleVal = "Default value").
10.1.6.2 Chart function
GUID-2AD060DE-E15D-4B93-95C4-3AF700B702B1 v2
Set FnType to "Chart" mode to enable this functionality. In this mode, the output is evaluated based
on linear interpolation and constant extrapolation using up to eight data points specified by the
settings {X1,Y1} and {X2,Y2} up to {X8,Y8}. Set CurvePoints to select the required number of input
and output relations. The functionality provides linear interpolation between the points and constant
extrapolation beyond the defined points.
The setting points shall be set in such a manner that X2 is greater than X1, X3 is
greater than X2 and so on till X8 is greater than X7. The settings of LowLimit and
HighLimit limit the input values. Hence the setting of X1 below LowLimit results in
output value for a limited proportional input value of LowLimit. Same is the case for
the last selected curve points based on the setting CurvePoints.
For example, if the input value is lower than X1 , the output is set to Y1. For every setting n for
CurvePoints defined, the output is set to Yn if the input is greater than Xn. For every input value
greater than X1 and less than Xn, the output is calculated according to the following conditions:
Maximum incremental value of i starting from 2 till maximum of n (n ≤ 8):
Xi such that INPUT ≥ Xi and
Xi +1 such that INPUT < Xi+1
IECEQUATION-0094 V2 EN-US
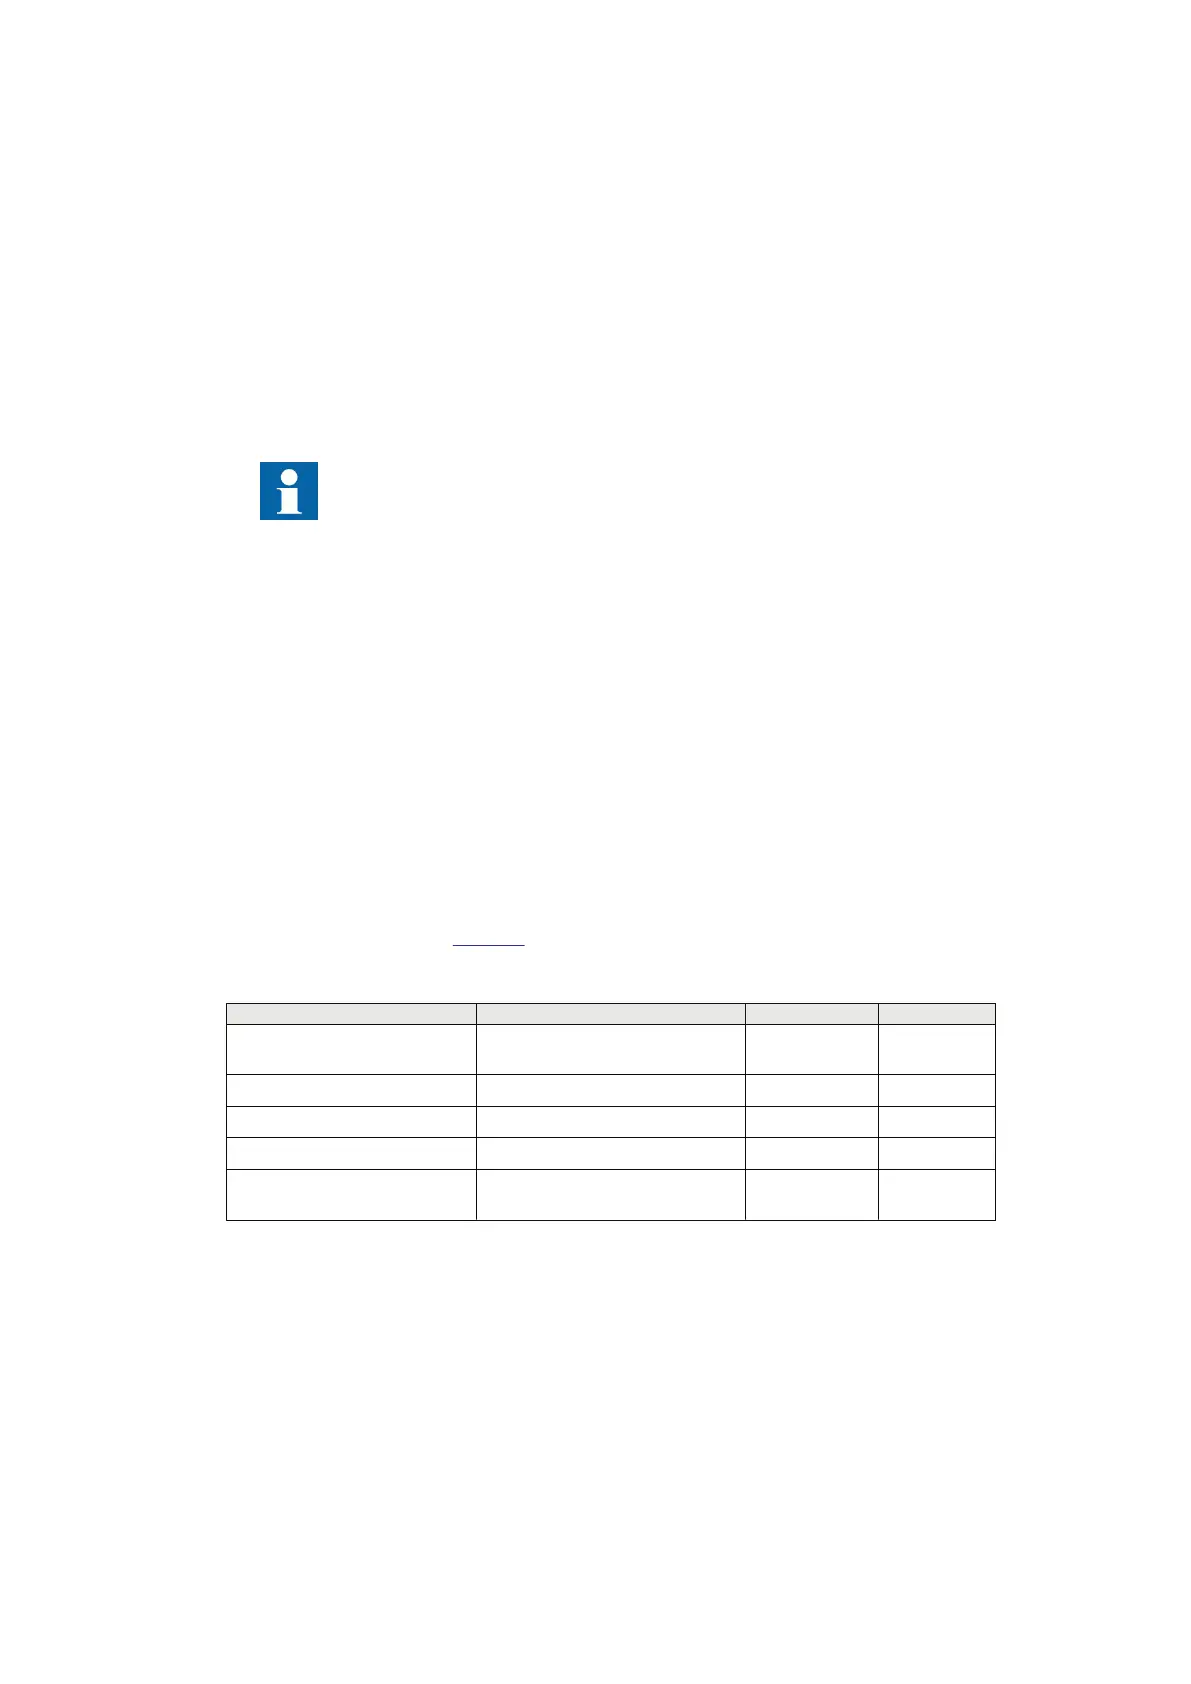
The WARNING output goes high whenever the input signal is outside the scaling range but still within
the supervision limits. See
Table 63.
Table 63: Assessment of input signal range
Range of INPUT signal
OPSIGNAL WARNING ALARM
INPUT < LowLimit Y1 or DefValue (as selected by
LimitScaleVal)
0 1
LowLimit ≤ INPUT < X1 Y1 1 0
X1 ≤ INPUT ≤ Xn scaled value 0 0
Xn < INPUT ≤ HighLimit Yn 1 0
INPUT > HighLimit Yn or DefValue (as selected by
LimitScaleVal)
0 1
10.1.6.3 Equation function
GUID-4A294515-E959-4956-8364-A6D6728A59B7 v2
Set FnType to "Equation" mode to enable this functionality. In this mode, the output is calculated as a
function of the input based on the constants declared in the following equation:
m n f x
y ax bx c d e
×
= + + + ×
IECEQUATION-0092 V1 EN-US
Where,
Section 10 1MRK 511 557-UEN Rev. A
General calculation
102
Technical Manual
© 2021 Hitachi Energy. All rights reserved.
 Loading...