294 43-TV-25-30 Iss.6 GLO Aug 07 UK
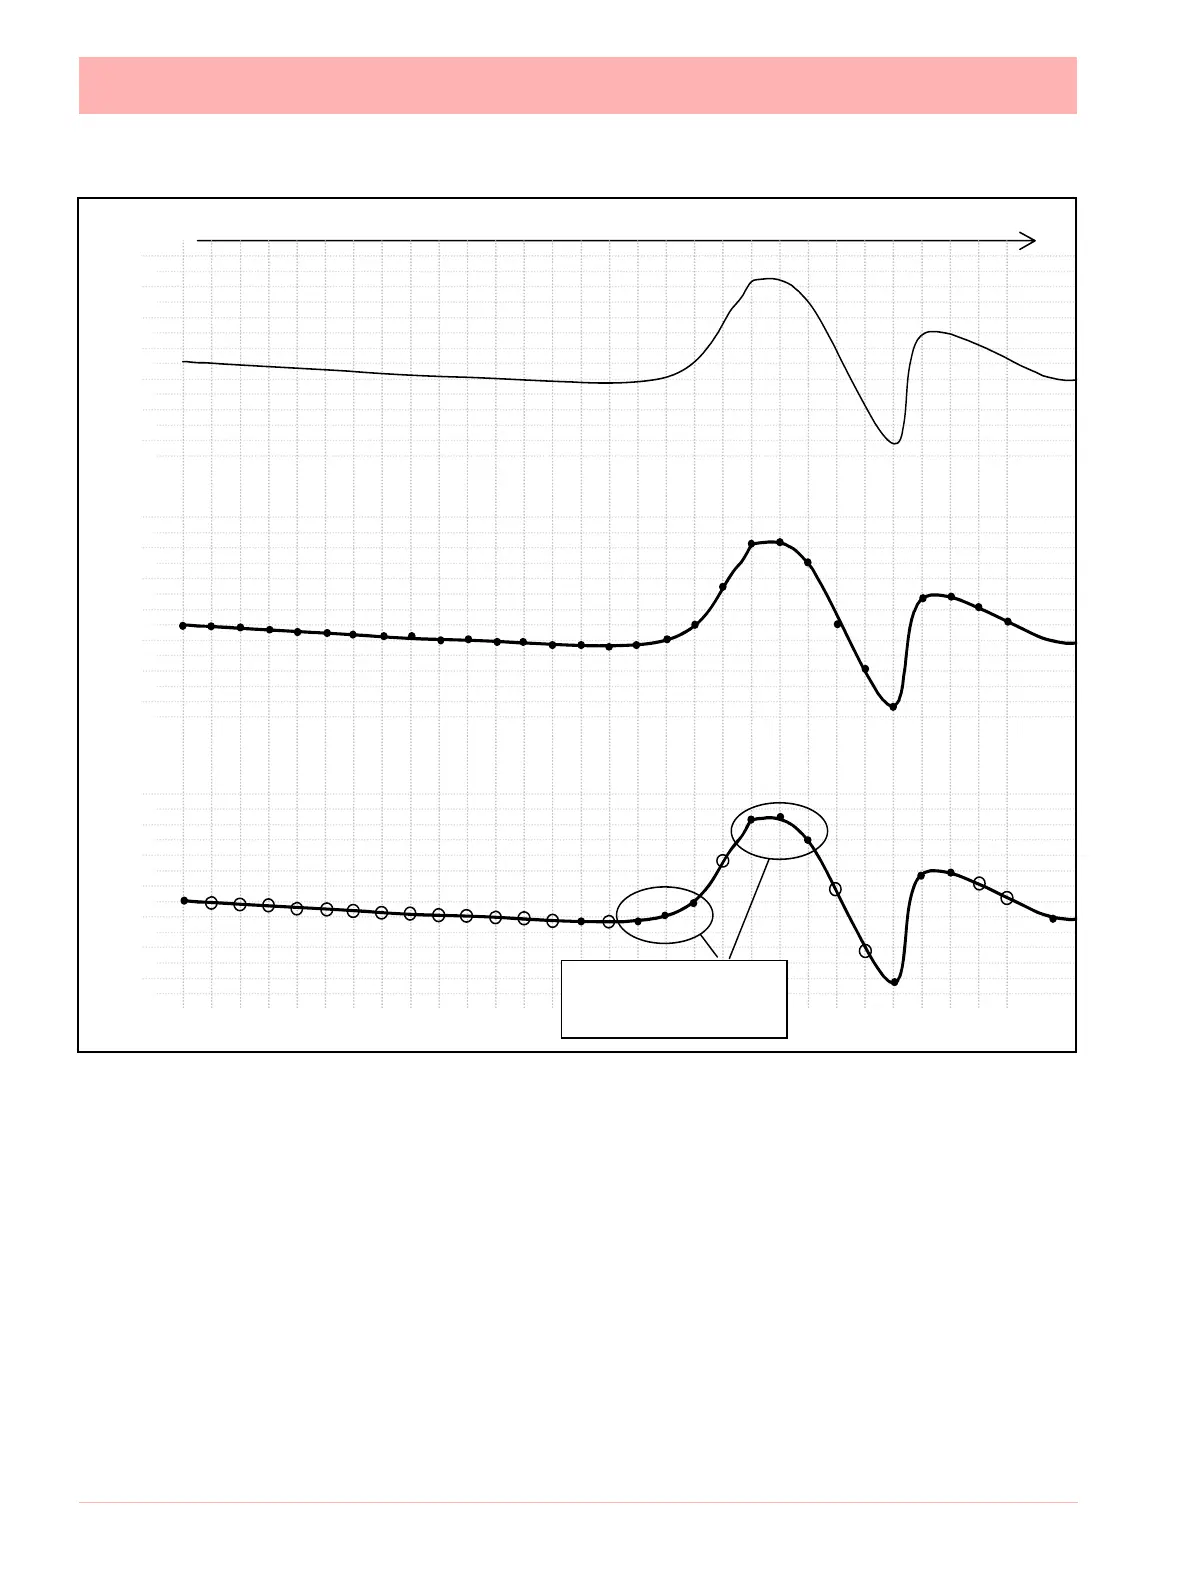
Diagram 1
Points marked:
are NOT logged, as they lie on an ‘imaginary’ straight line between points
marked:
The graph of the Fuzzy Logged data, looks identical to the graph of the sampled data, but
has taken less than half the points to build it.
What about ‘Spikes’ on my trend line? Won’t it miss them?
NO, you will not miss any ‘Spikes’, ‘Glitches’ or ‘Transients’ – these are what you need to
see!
As Fuzzy Logging is an adaptive technique, it will log as fast as it needs to in order to capture
everything.
Although not all points are logged, the base ‘Scan Rate’ of the input is the same as if you
were using a standard logging technique.
7
6
5
4
3
2
1
7
6
5
4
3
2
1
7
6
5
4
3
2
1
Time
Input Signal
Continuously Sampled
Fuzzy Logged dat
:
12 points only!
Changing ‘slope’ requires
more data points to be logged,
to capture the shape correctly.
 Loading...