6. To measure another frequency, select the appropriate active segment.
When either of these calibration pro cedures is complete, the device can be connected for
measurement.
Again, in both of these pro cedures, note that when you press the key to measure the
calibration standard, the HP 8510 pulse output is set to the active state (RF always On)
during measurement of the standard. This ensures that the calibration data at every pointis
with respect to the On portion of the pulse.
Measurement
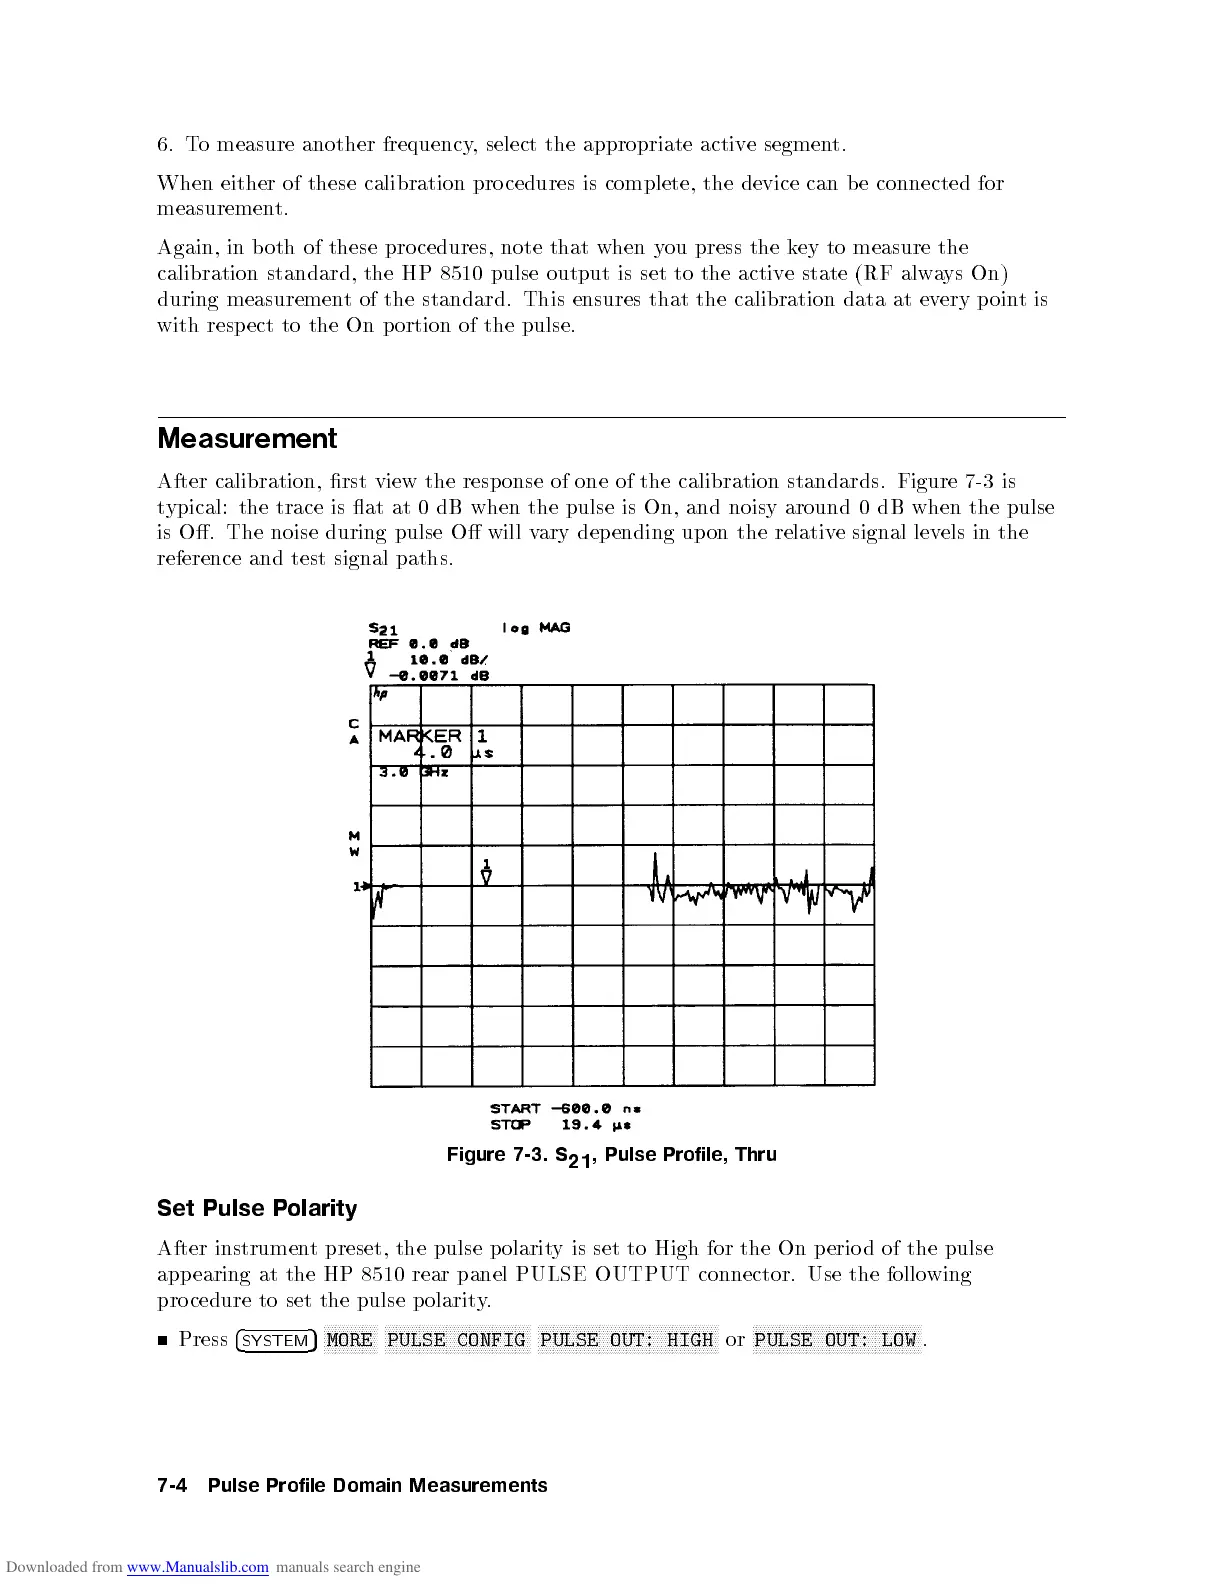
After calibration, rst view the response of one of the calibration standards. Figure 7-3 is
typical: the trace is at at 0 dB when the pulse is On, and noisy around 0 dB when the pulse
is O. The noise during pulse O will vary depending upon the relative signal levels in the
reference and test signal paths.
Figure 7-3. S
21
, Pulse Profile, Thru
Set Pulse P
olarity
After instrumen
t preset, the pulse p olarit
y is set to High for the On p erio d of the pulse
appearing at the HP 8510 rear panel PULSE OUTPUT connector. Use the follo wing
pro cedure to set the pulse p olarity.
Press
4
SYSTEM
5
NNNNNNNNNNNNNN
MORE
NNNNNNNNNNNNNNNNNNNNNNNNNNNNNNNNNNNNNN
PULSE CONFIG
NNNNNNNNNNNNNNNNNNNNNNNNNNNNNNNNNNNNNNNNNNNNNNN
PULSE OUT:
HIGH
or
NNNNNNNNNNNNNNNNNNNNNNNNNNNNNNNNNNNNNNNNNNNN
PULSE OUT:
LOW
.
7-4
Pulse
Profile
Domain
Measurements