EasyManua.ls Logo

HP HP-28S - Single-Sample Statistics; Finding the Mean

HP HP-28S
341 pages
To Next Page IconTo Next Page
To Previous Page IconTo Previous Page
Loading...
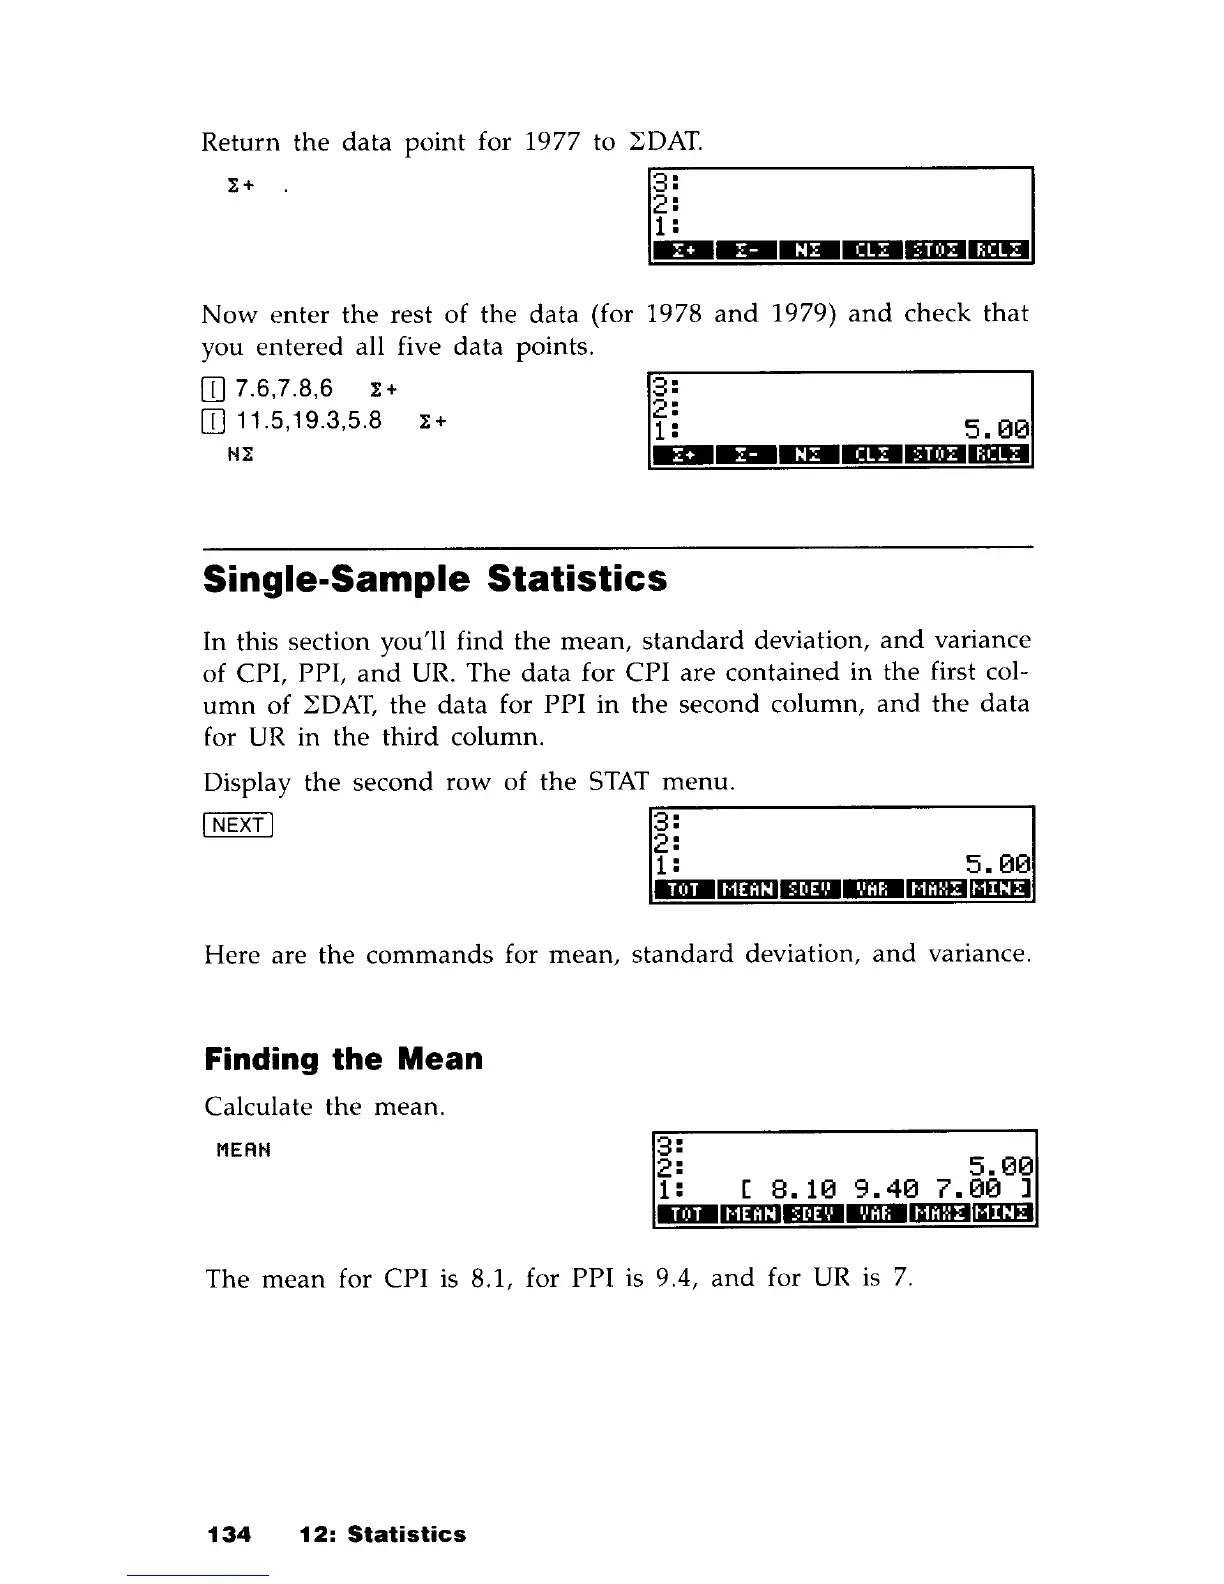
Return
the
data
point
for 1977 to
~DAT.
~--------------------~
,.
. IL--
___
I
Now
enter
the
rest
of
the
data
(for 1978
and
1979)
and
check
that
you
entered
all five
data
points.
CD
7.6,7.8,6
I+
CD
11.5,19.3,5.8 I +
Single-Sample
Statistics
In this section you'll
find
the
mean,
standard
deviation,
and
variance
of CPI, PPI,
and
UR.
The
data
for
CPI
are
contained
in
the
first col-
umn
of
~DAT,
the
data
for
PPI
in
the
second
column,
and
the
data
for UR
in
the
third
column.
Display
the
second
row
of
the
STAT
menu.
~--------------------~
INEXTI
3:
2:
1:
5.00
IlIimGmmmDmIllGIlIIHIIillB
Here
are
the
commands
for
mean,
standard
deviation,
and
variance.
Finding
the
Mean
Calculate
the
mean.
MEAN
3:
2:
5.00
1:
[8.10
9.40
7.00
]
IlIimGmmmDmIllGIlIIHIIillB
The
mean
for
CPI
is 8.1, for
PPI
is 9.4,
and
for UR is
7.
134
12:
Statistics

Table of Contents

Other manuals for HP HP-28S

Related product manuals