EasyManua.ls Logo

Instrutech Super Bee CVM201 - Log-Linear Analog Output - Mbar

Instrutech Super Bee CVM201
34 pages
Print Icon
To Next Page IconTo Next Page
To Previous Page IconTo Previous Page
Loading...
Instruction Manual CVM201 Super Bee
InstruTech, Inc. Page 23
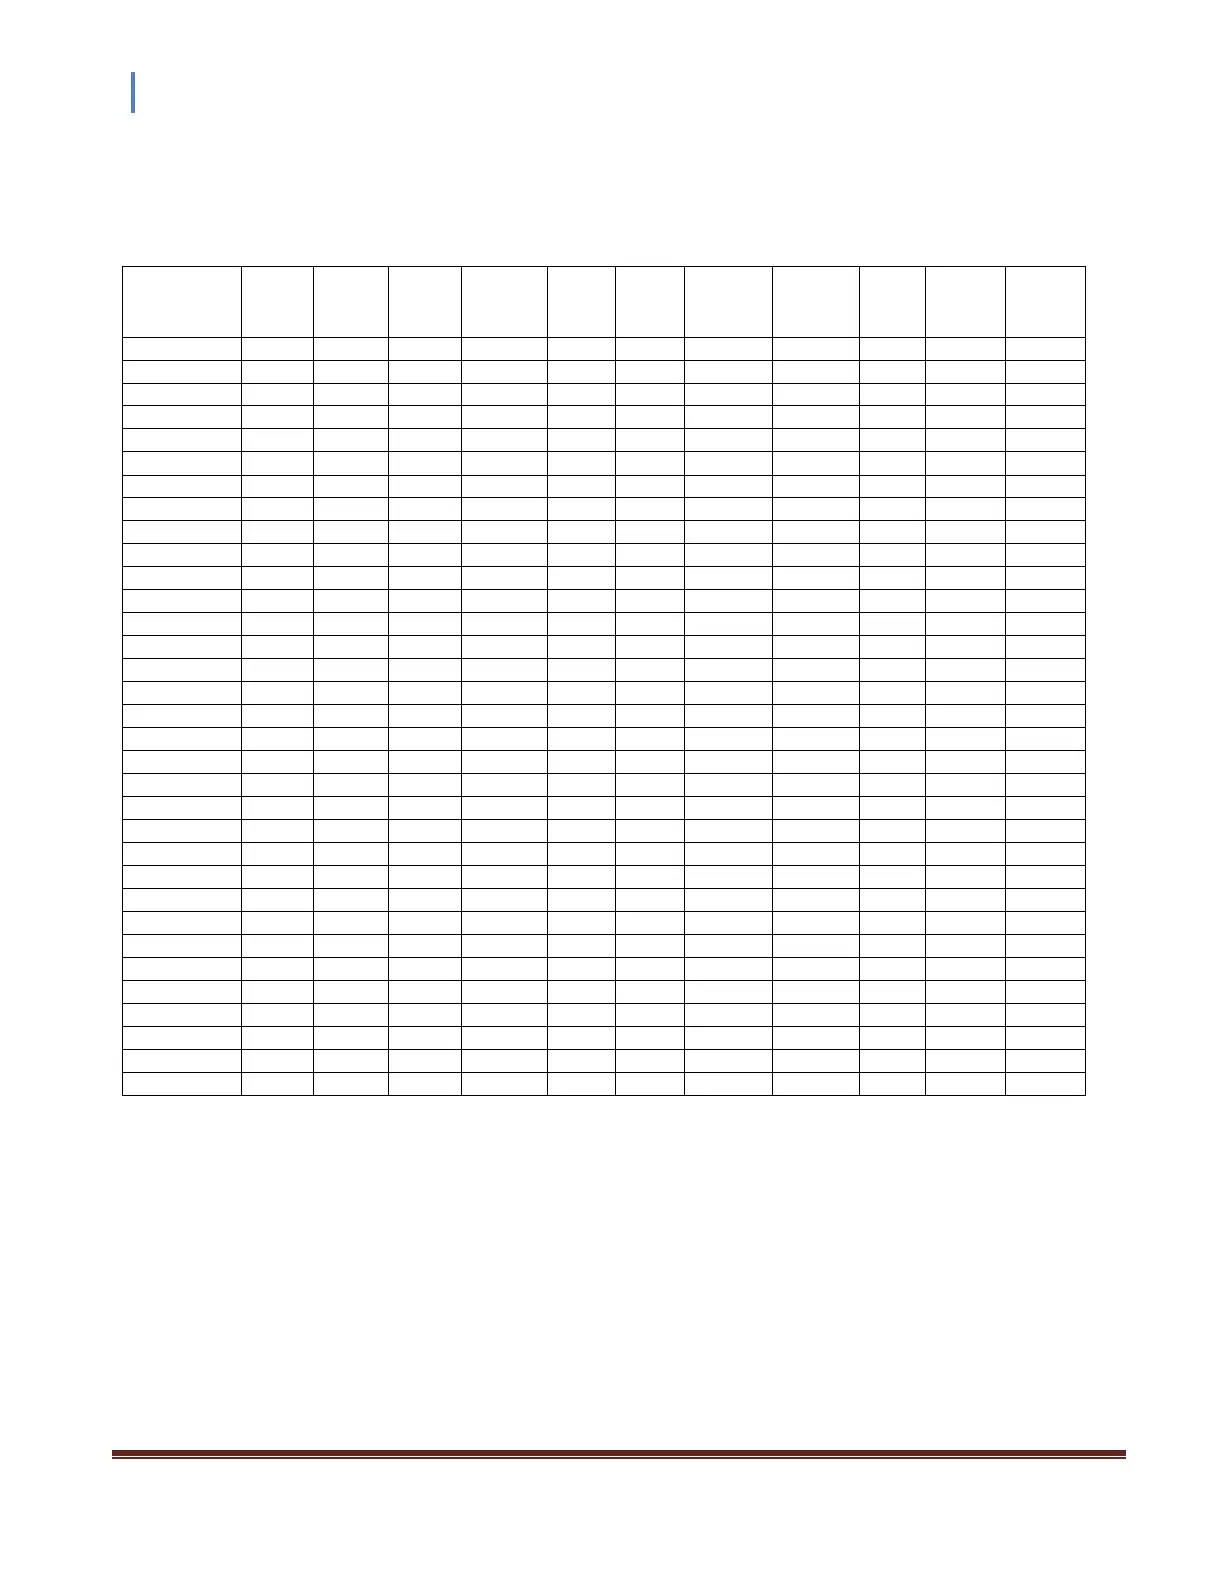
7.4 Log-Linear Analog Output - mbar
Log-Linear analog output for selected gases - Engineering units in mbar
True
Pressure
(mbar)
N
2
Ar
He
O
2
CO
2
KR
Freon12
Freon22
D
2
Ne
CH
4
0.0001
1.000
1.000
1.000
1.000
1.000
1.000
1.000
1.000
1.000
1.000
1.000
0.0002
1.301
1.301
1.301
1.301
1.301
1.301
1.301
1.301
1.301
1.301
1.301
0.0005
1.699
1.699
1.699
1.699
1.699
1.523
1.699
1.699
1.699
1.699
1.699
0.0010
2.000
1.903
1.938
2.000
2.028
1.668
2.125
2.125
2.080
1.903
2.167
0.0020
2.301
2.146
2.204
2.301
2.355
1.970
2.487
2.487
2.392
2.166
2.523
0.0050
2.699
2.524
2.602
2.699
2.672
2.370
2.883
2.855
2.778
2.551
2.893
0.0100
3.000
2.820
2.908
2.991
3.012
2.675
3.172
3.136
3.082
2.849
3.186
0.0200
3.301
3.188
3.208
3.294
3.345
2.979
3.473
3.434
3.385
3.150
3.484
0.0500
3.699
3.512
3.607
3.693
3.741
3.372
3.863
3.837
3.779
3.543
3.886
0.1000
4.000
3.809
3.928
3.989
4.033
3.671
4.157
4.136
4.082
3.844
4.197
0.2000
4.301
4.103
4.217
4.288
4.325
3.963
4.445
4.424
4.393
4.148
4.500
0.5000
4.699
4.495
4.634
4.686
4.696
4.341
4.798
4.783
4.828
4.553
4.893
1.0000
5.000
4.784
4.962
4.987
4.982
4.614
5.044
5.037
5.174
4.867
5.201
2.0000
5.301
5.064
5.324
5.288
5.249
4.865
5.250
5.255
5.579
5.192
5.517
5.0000
5.699
5.404
6.070
5.695
5.550
5.141
5.447
5.471
7.288
5.696
5.877
10.0000
6.000
5.633
8.125
6.008
5.743
5.309
5.556
5.602
8.125
6.252
6.374
20.0000
6.301
5.815
8.125
6.337
5.886
5.433
5.621
5.675
8.125
7.608
7.409
50.0000
6.699
5.969
8.125
6.862
6.002
5.514
5.680
5.722
8.125
8.125
7.930
100.0000
7.000
6.045
8.125
7.282
6.065
5.548
5.751
5.780
8.125
8.125
8.125
200.0000
7.301
6.093
8.125
7.526
6.157
5.606
5.851
5.877
8.125
8.125
8.125
300.0000
7.477
6.131
8.125
7.625
6.253
5.654
5.918
5.950
8.125
8.125
8.125
400.0000
7.602
6.178
8.125
7.705
6.353
5.679
5.962
6.000
8.125
8.125
8.125
500.0000
7.699
6.237
8.125
7.786
6.448
5.710
5.996
6.038
8.125
8.125
8.125
600.0000
7.778
6.295
8.125
7.861
6.532
5.734
6.025
6.070
8.125
8.125
8.125
700.0000
7.845
6.349
8.125
7.928
6.611
5.754
6.050
6.097
8.125
8.125
8.125
760.0000
7.881
6.380
8.125
7.965
6.658
5.765
6.063
6.112
8.125
8.125
8.125
800.0000
7.903
6.399
8.125
7.988
6.687
5.772
6.072
6.122
8.125
8.125
8.125
900.0000
7.954
6.488
8.125
8.042
6.766
5.787
6.092
6.146
8.125
8.125
8.125
1000.0000
8.000
6.494
8.125
8.092
6.847
5.799
6.111
6.167
8.125
8.125
8.125
1100.0000
8.041
6.539
8.125
8.125
6.936
5.812
6.128
6.187
8.125
8.125
8.125
1200.0000
8.079
6.580
8.125
8.125
7.028
5.822
6.146
6.204
8.125
8.125
8.125
1300.0000
8.114
6.624
8.125
8.125
7.140
5.828
6.164
6.222
8.125
8.125
8.125
1333.0000
8.125
6.636
8.125
8.125
7.169
5.830
6.169
6.228
8.125
8.125
8.125
Values listed under each gas type are in volts.
The log-linear output signal and pressure are related by the following formulas:
P = 10
(V - 5)
V = log
10
(P) + 5
where P is the pressure in mbar, and V is the output signal in volts.
An analog output of less than 0.01 volts to near 0 volt indicates a damaged or faulty sensor.
The chart on the following page shows the graphical results of the table and formulas given above for nitrogen.
True pressure (N
2
) is plotted on the X-axis with a log scale. The output signal is plotted on the Y-axis on a linear scale.

Related product manuals