OtoRead Screener Interpreting Test Results Page 34
Interpreting Test Results
Understanding the Display
The display on the OtoRead test instrument will indicate the results of
the test with a graphic display. The display will be generated and
shown during the test and can be reviewed after the test is complete.
The display might differ depending on the settings used for the test.
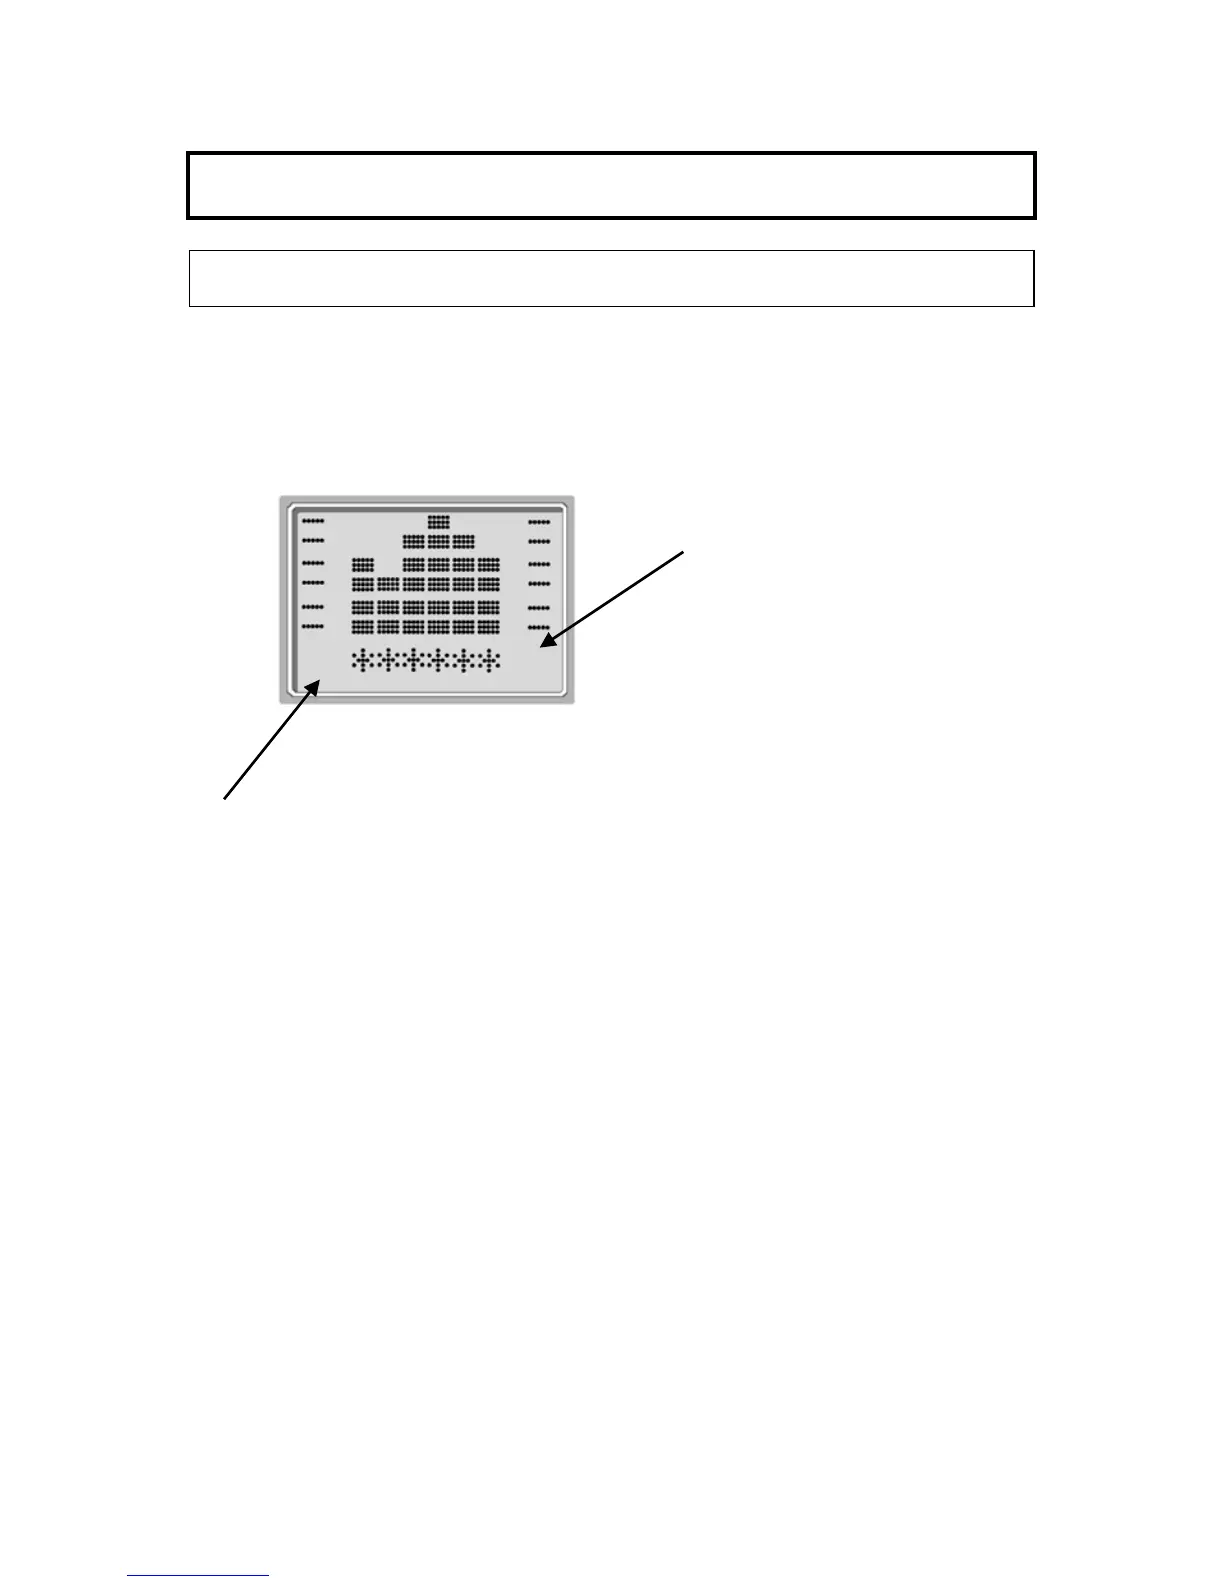
The display shows a 6-column graph. Each frequency (DPOAEs) or
frequency band (TEOAEs) is indicated by one column. Either 4 or 6
columns appear depending on how many frequencies are tested.
Each row represents 2 dB of signal-to-noise ratio (SNR). For
example, if the column goes to the top of the display then the SNR is
12 dB or greater (6 rows of 2 dB each).
The display is shown while the test is being performed. To review the
display after the test is finished, press the REVIEW key to look at the
display.