For Your Safe Flight Page | 4
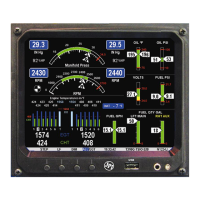
Linear Bar Graphs Display Basics
The Bar Graphs section contains seven
dedicated bar graphs with digital display
organized as shown to the right. Pointers
move up and down for each engine in
response to value changes and digital
readouts turn red when exceedances
occur.
Note: functions displayed in this example
may differ from your EDM.