Interactive SourceMeter® Instrument User's Manual Section 5: Measuring low-
2450-900-01 Rev. C / December 2013 5-5
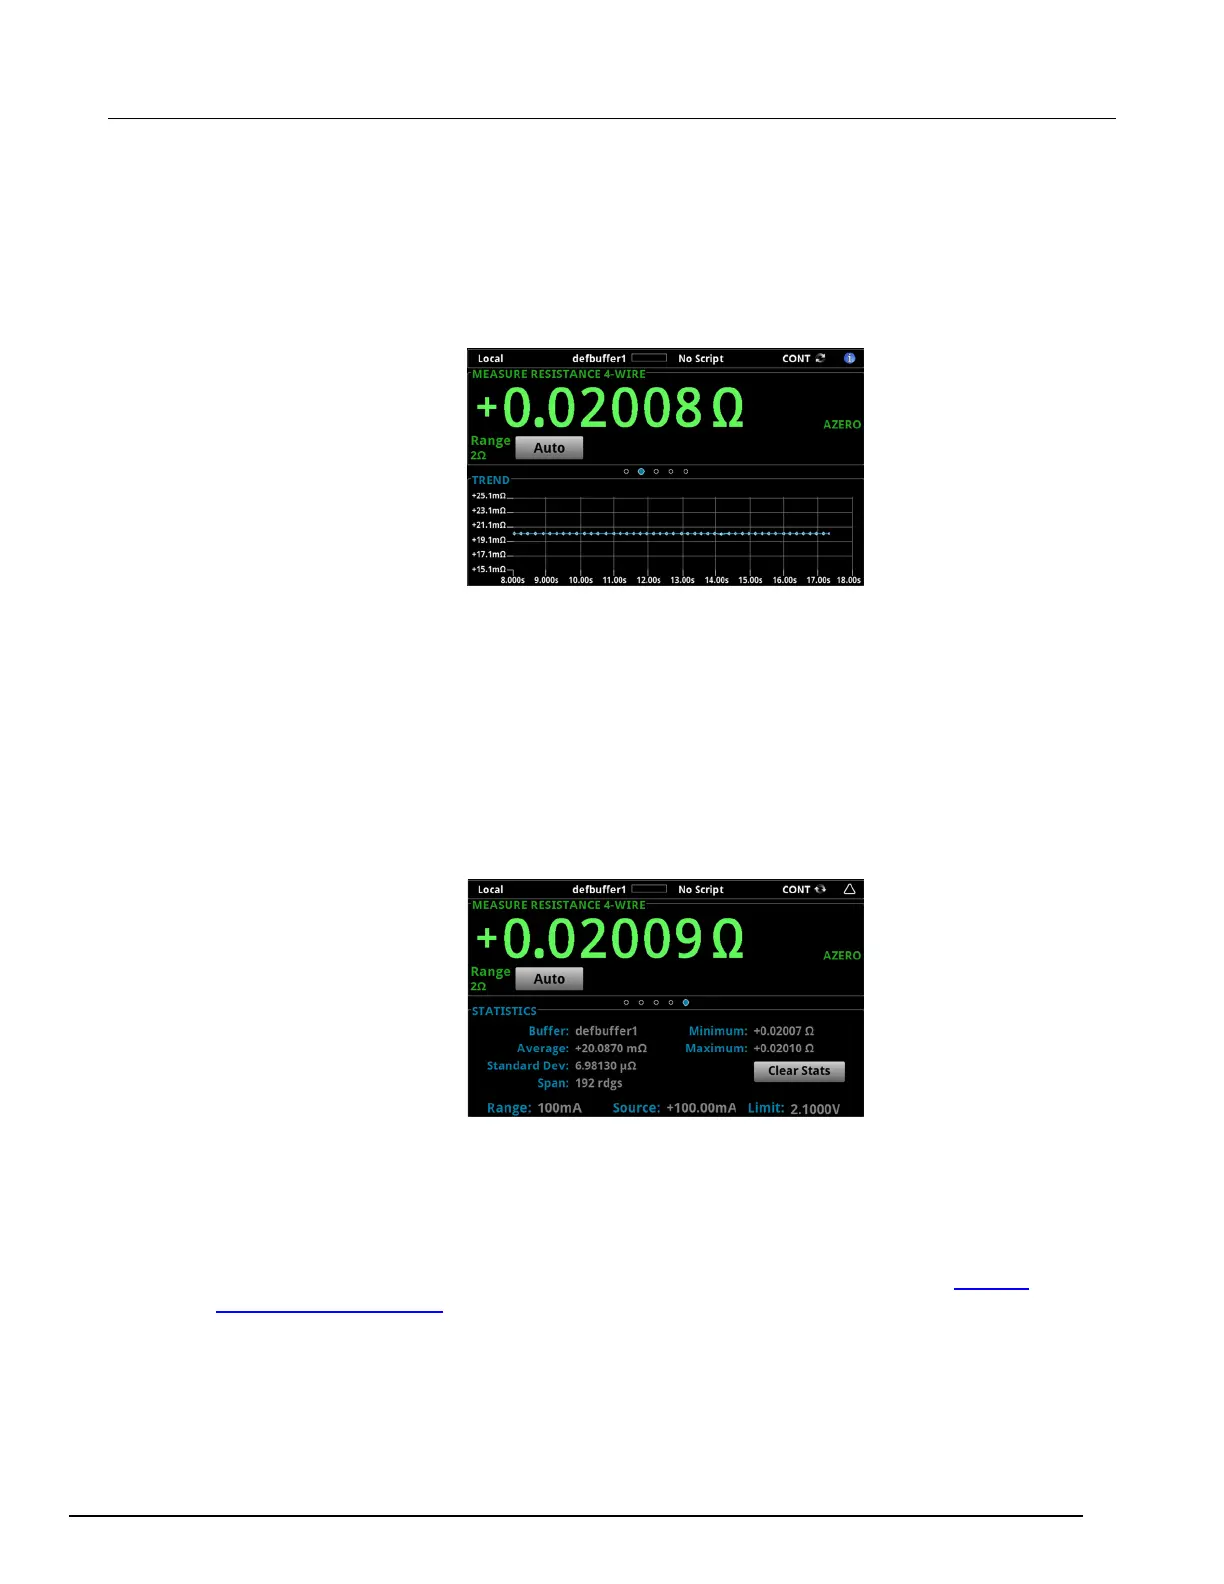
View the measurements on the front-panel TREND swipe screen
You can view the resistance measurements as a function of time on the front-panel TREND swipe
screen. To access the TREND swipe screen, swipe the bottom part of the Home screen to the right.
The graph in the figure below is displayed.
Figure 20: TREND swipe screen
To see the graph on the full screen, swipe up on the TREND swipe screen to open the Graph screen.
View the buffer statistics on the front panel
You can view the measurement statistics on the Model 2450 front panel, including:
• Buffer name
• Minimum, maximum, and average reading values
• Standard deviation
Figure 21: STATISTICS swipe screen
Set up remote communications
You can run this application from the front panel or any of the supported communication interfaces for
the instrument (GPIB, USB, or ethernet).
The following figure shows the rear-panel connection locations for the remote communication
interfaces. For additional information about setting up remote communications, see
Remote
communication interfaces (on page 3-1).