Calibration Issues
6400-02(B) LED Source
18-26 Using the LI-6400
18
When done, the program will show the data and provide you with an oppor-
tunity to plot it (Figure 18-20). You can also view the current LED source cal-
ibration later by selecting "_LED Source - Plot Curve".
To actually implement this calibration data, you must respond by pressing Y
when asked (Figure 18-21).
SetPt: 100 mV
QNTM: 45.3 µmol/m2/s
LED Source WarmUp
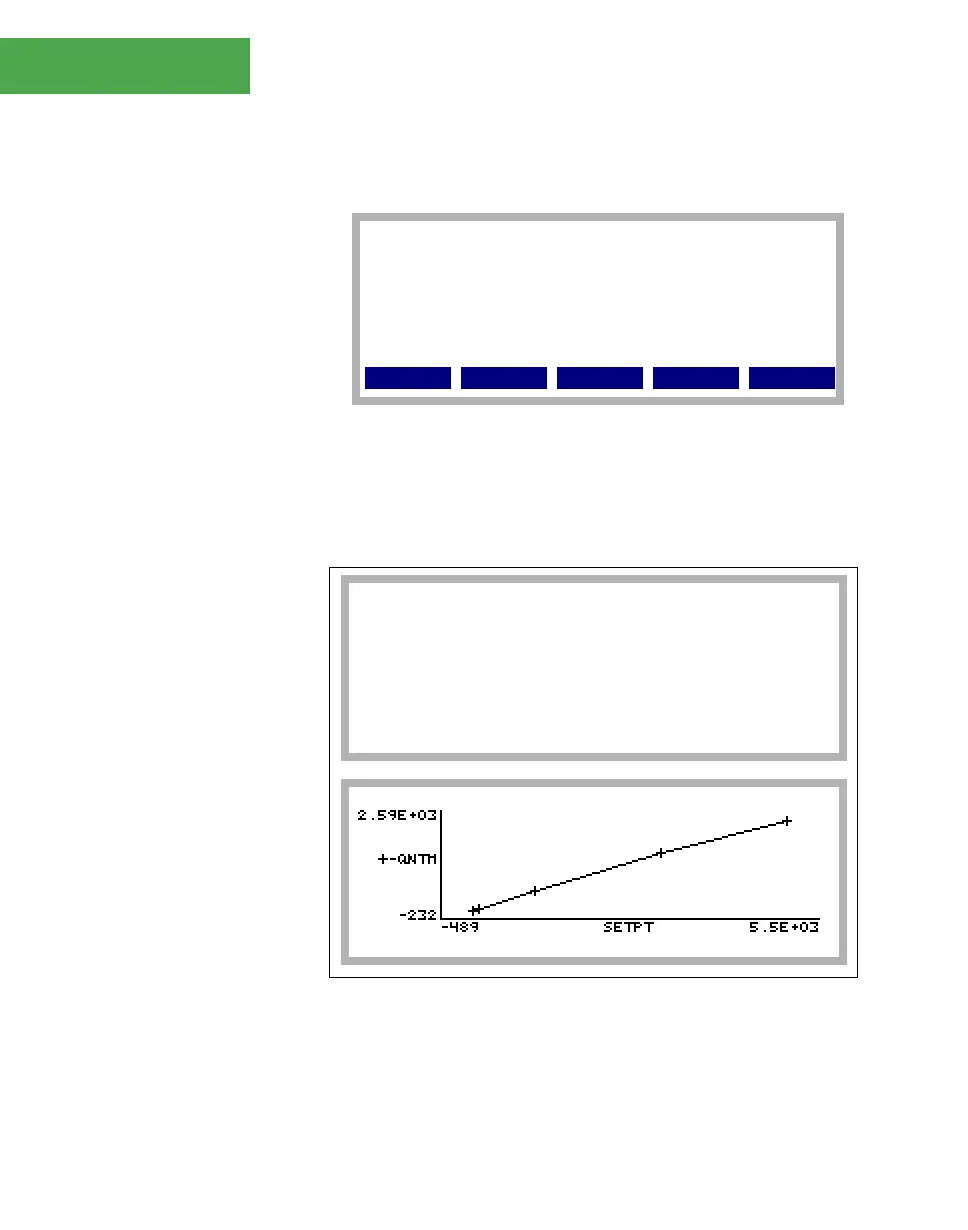
Figure 18-19. The calibration curve is generated automatically. SetPt is
the command signal, and QNTM is the resulting PAR (µmol m
-2
s
-1
).
Abort
SetPt(mV) Qntm(umol/m2/s)
10 3.391
100 45.64
1000 507.5
3000 1493
5000 2358
Plot this? (Y/N)
Figure 18-20. The LED source calibration data is displayed, and you are
given a chance to plot the graph.
 Loading...