Gocator Line Profile Sensors: User Manual
• 551
Debugging Your Measurement Tools
We highly recommend using the emulator to debug measurement tools you create with the GDK. By
using a Gocator support file and previously recorded scan data, downloaded from a physical sensor, you
can completely simulate standalone and dual-sensor configurations on a PC to test your tools.
To debug your tools in the emulator:
1. Compile your code using the Win32 target (Debug or Release).
2. In the output directory, rename the DLLwith the same name as your project to GdkApp.dll.
For example, if your project is called MyGDKTools, the resulting DLLshould be called MyGDKTools.dll. You
rename this DLLto GdkApp.dll.
The output directories are as follows:
Release:win32
Debug: win32d
3. Launch the emulator from same output directory as in step 2.
4. In the emulator, choose a scenario and start it.
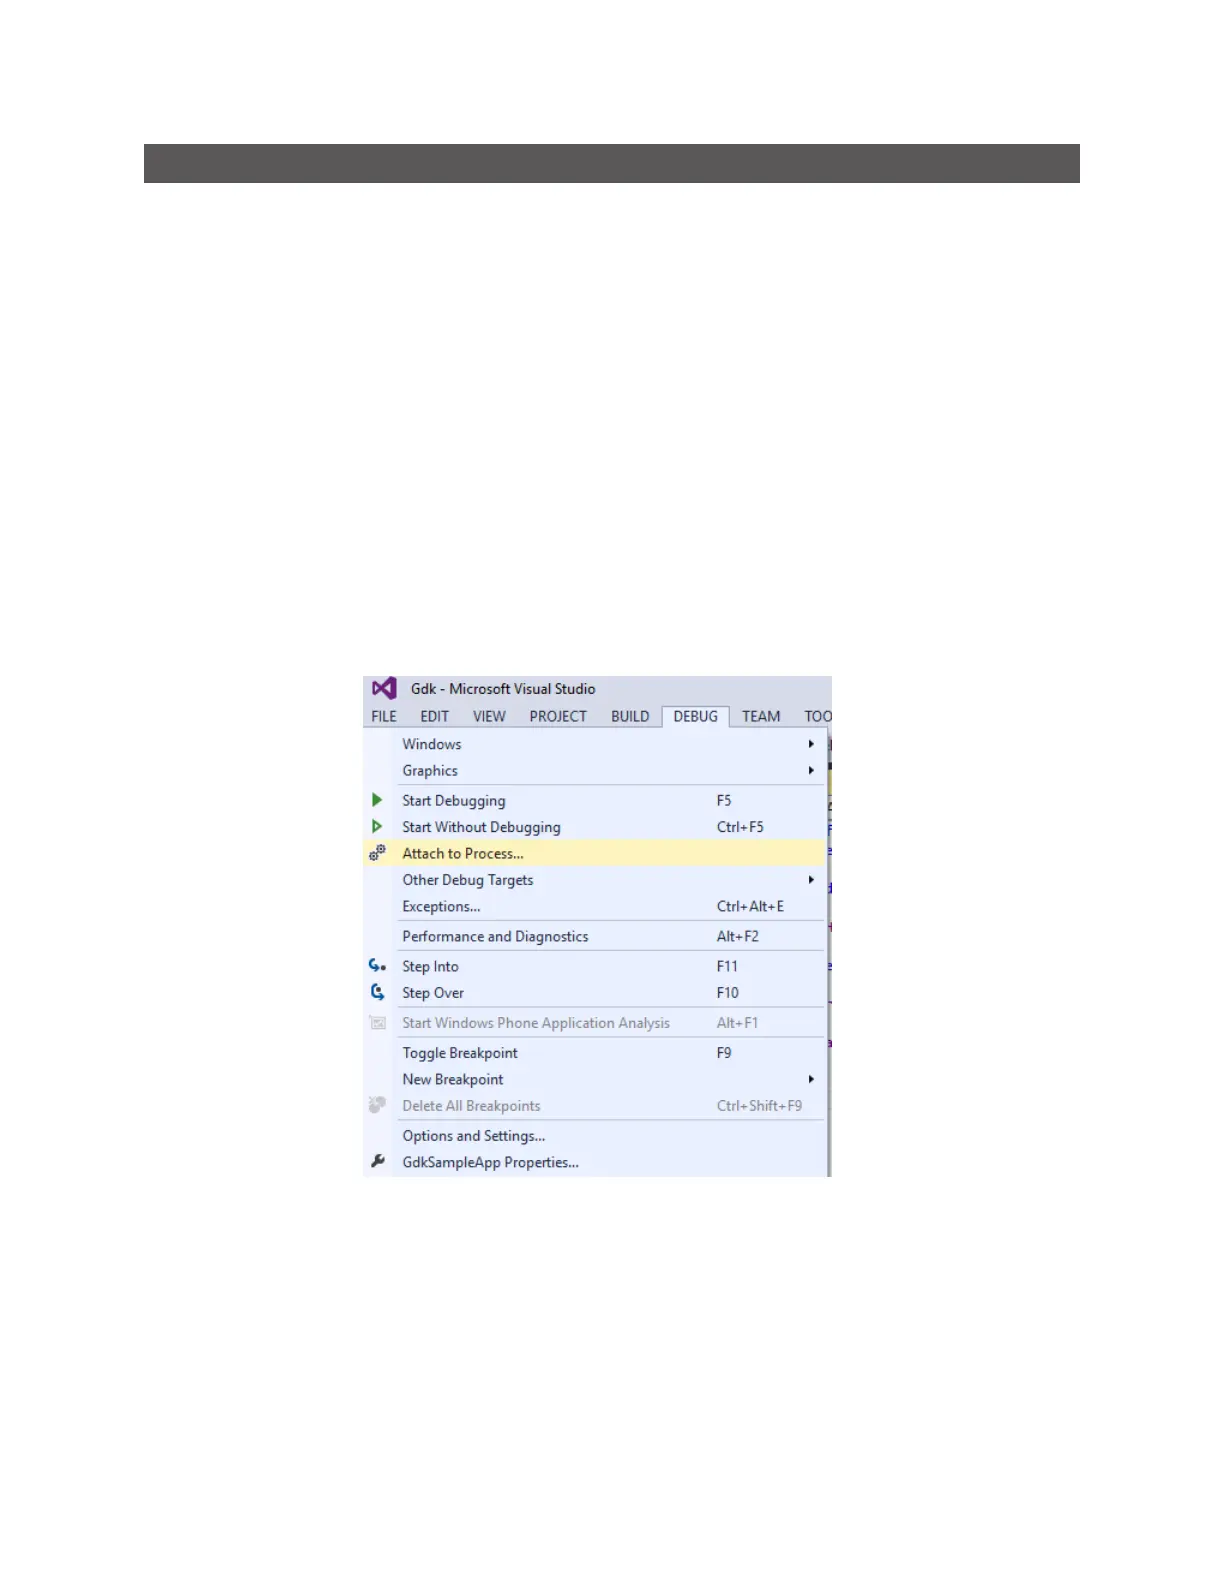
5. In Visual Studio, attach the debugger to the kFramework.exe process.