.
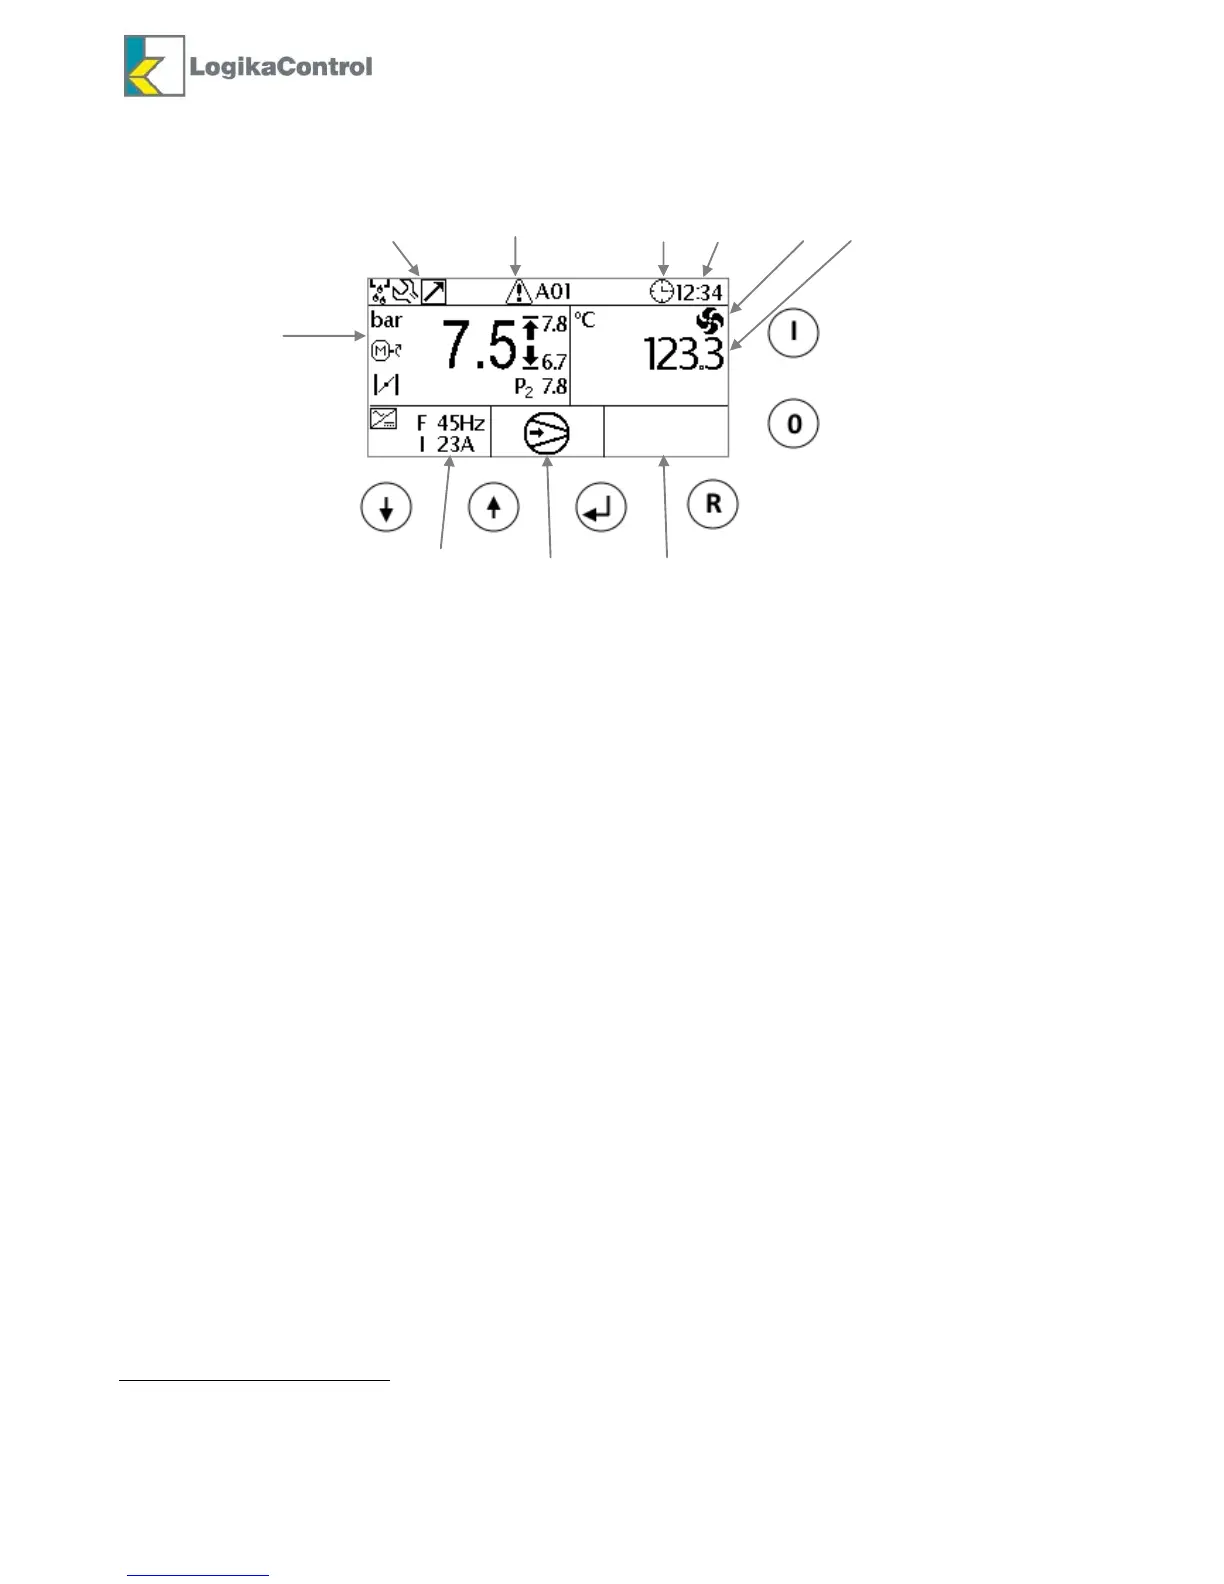
According the pic. above and related icons, the main visualization can be described as below:
1. General icons, where be present the following:
I01, Condensate drain in operation
I02, Multiunit operation
I03, Master/slave operation
I04, Maintenance messages
2. Alarm or maintenance messages: if an alarm is detected the display visualizes the icon I05, if maintenance timer is
over visualizes icon I04.
3. Start/stop by timer activated.
4. Time (hours and minutes).
5. Icons I12 when fan ON
6. Air end temperature
7. Inverter area: data visualized when output 4/20mA or RS485 inverter are enabled. In case output 4/20mA is
activated the display shows the PID frequency set (F) and eventual data set on the input 4/20mA (parameter
C19). In case of inverter via RS485 all the data from the inverter are visualized: frequency (F), current (I), power
(P) and temperature (T). Data are visualized on the right side (7b) or left side (7a) according the inverter
configuration is on the air end temperature or working pressure.
8. Compressor status: icons from I07 to I13 as below:
Compressor OFF
Witing for safety timer
Pressure set
Remote start/stop open
Compressor ON
Waiting for start/stop by timer (in this case the display visualizes the day of the week and time of the
next ON by timer).
Waiting for internal pressure P2 lower than parameter AP4
9. Pressure area:
Working pressure (BIG) and stop/start pressures.
Aux pressure transducer (if enabled).
Icon I17, motor run
Icon I18, load solenoid valve open
In case of alarm, the below side of the display (7a, 7b and 8) visualizes the alarm message
The controller is provided with 6 key-buttons with following functions: (with reference to the above pic.):
- T1, decrease, select down
- T2, increase, select up
- T3, change or confirm
- T4, reset or back
- T5, stop compressor
- T6, start compressor
 Loading...