1600/1800 Manual
14
Note: ①The Abs. or T% of the samples will not display on the screen,
they were saved in the RAM.
The range or concentration is 0-9999,other number is invalid.
③The sequence of concentration is from low to high.
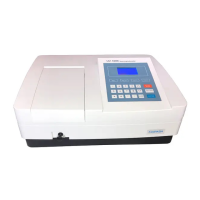
Display Standard Curve
Move the cursor on “Display Curve” by pressing【】and 【】, followed
by pressing 【ENTER】, the standard curve you just established will display
on the screen. The equation displays on the bottom of the screen. (Fig. 16),
and it will also be saved in the system.
1
ENTER
2
RETURN
3
Fig. 16
1、Standard Curve
2、Relative Coefficient.
3、Curve Equation
C=1.001*A+0.2,
C: Concentration
A: Value of Abs.
The slop value of the curve is 1.001.
The intercept of the curve is 0.2.
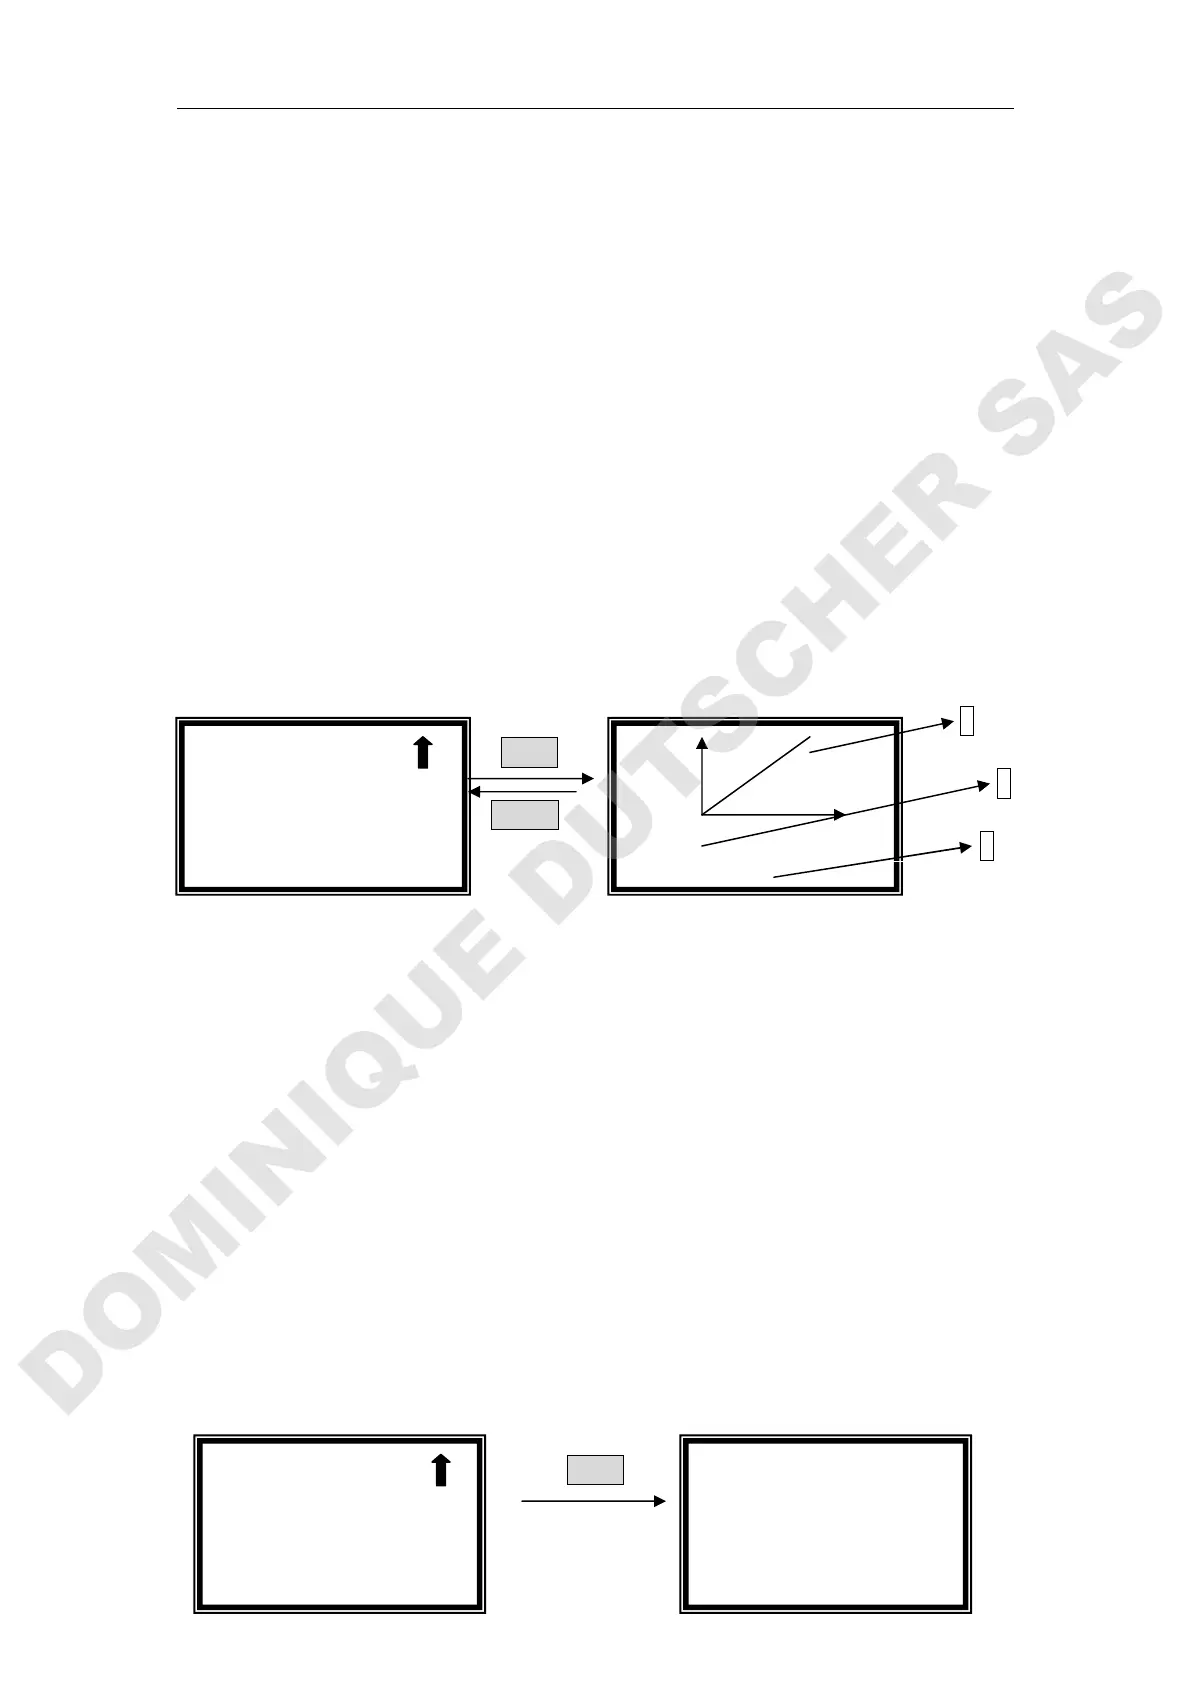
If the system gives a fault hint, check the standard sample and your inputting,
press any key to return and repeat your performance. (Fig. 17)
ENTER
√
√√
√Standard Curve
○
○○
○Concentration
0.500A
0
r=0.999 0.8C
√
√√
√Standard Curve
○
○○
○Concentration
Establish Wrong!
!!
!