1600/1800 Manual
24
time. And the time will also be displayed in the middle of the bottom screen in
real time.
Press 【STOP】can interrupt the test. When 【START】being pressed again,
the test will start again from the very beginning.
Note: the curve can not be printed, if you want to check the data of
every dot, you can choose “Display Data” in the parameter setting
interface.
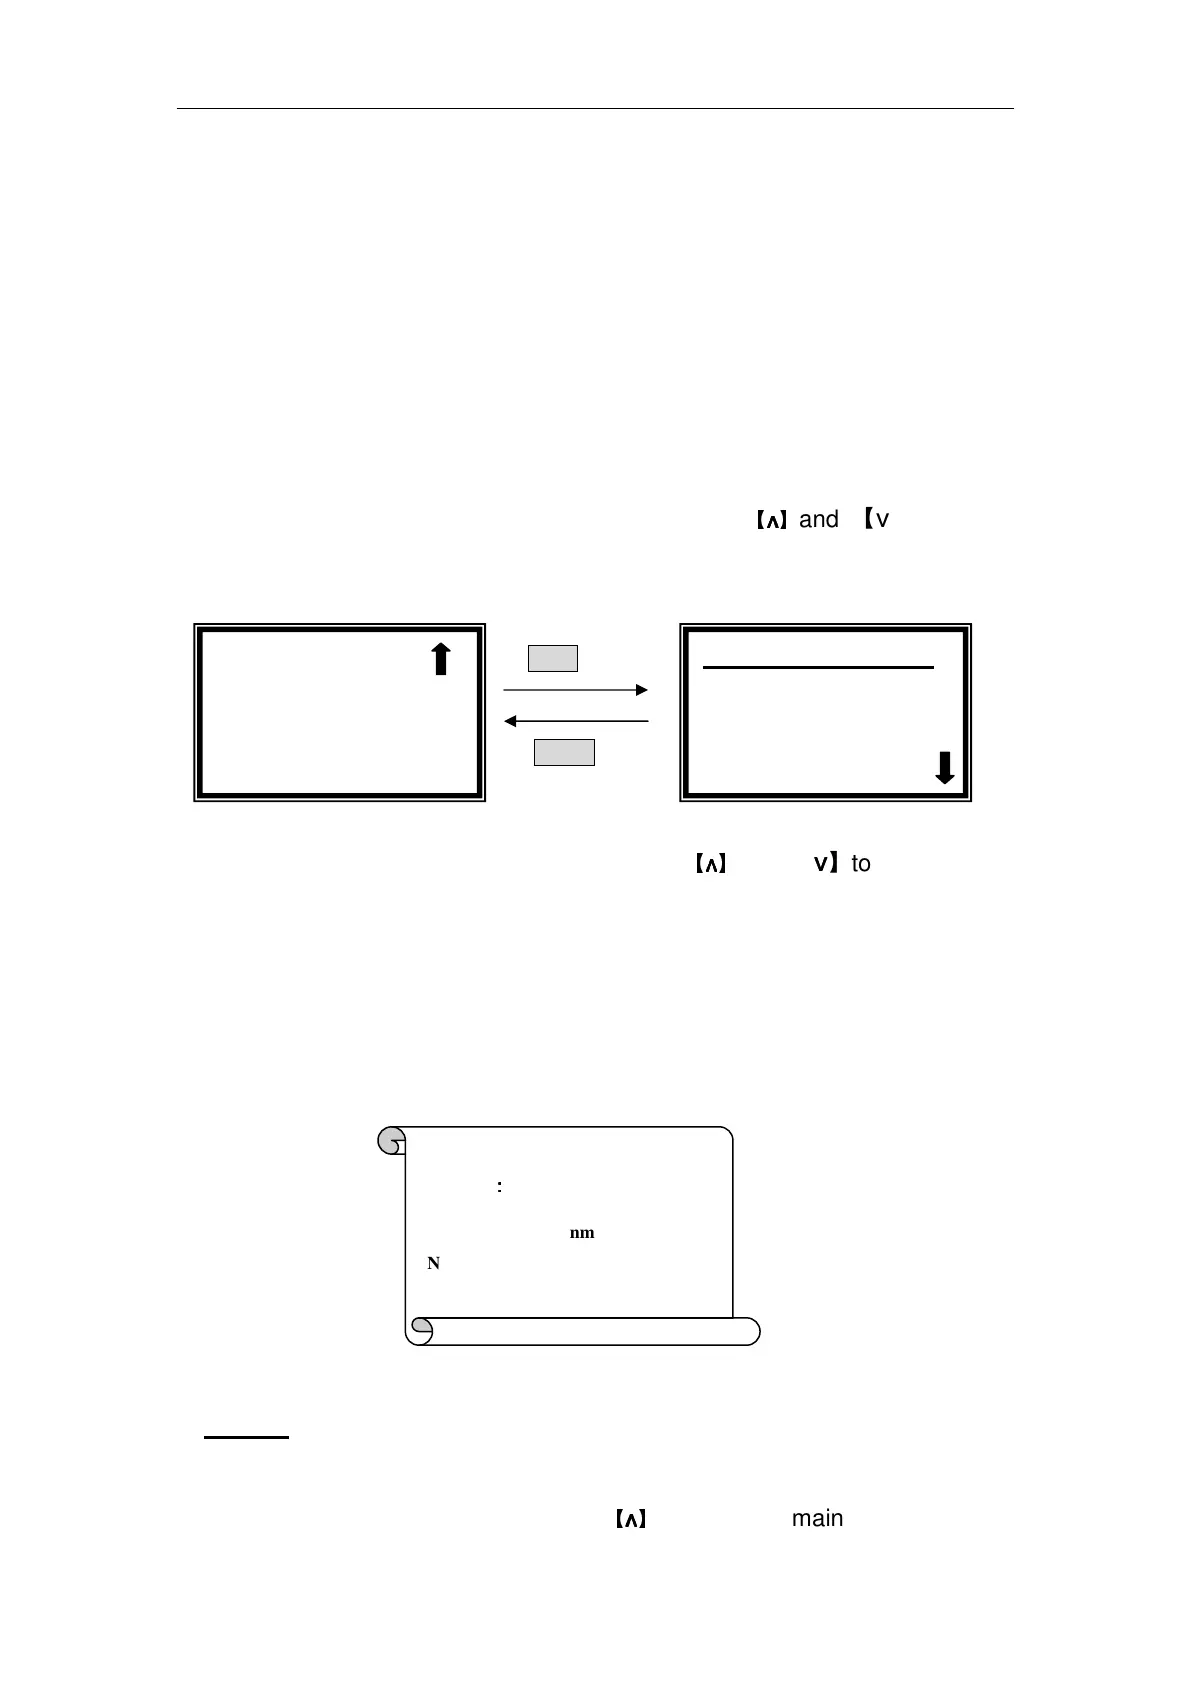
Display Data
Move the cursor on “Display Data” by pressing
【
∧
∧∧
∧
】
and 【∨
∨∨
∨】in setting
interface, followed by【ENTER】.(Fig. 38)
ENTER
RETURN
Fig. 38
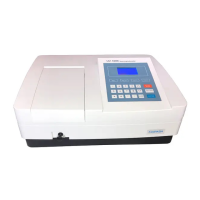
5 lines of data be displayed every screen. press
【
∧
∧∧
∧
】
and 【∨
∨∨
∨】to scroll.
Data Print
Press 【PRINT】in the right interface of Fig.38, the data will be printed.
After printing, the data will be deleted from the screen and RAM.
Press 【CLEAR】can also delete the data.(Fig. 39)
Fig. 39
4. Utility
Move the cursor on “Utility” by pressing
【
∧
∧∧
∧
】
and 【∨
∨∨
∨】in main menu, followed
√ Kinetics
○
○○
○Upper Limit
○
○○
○Lower Limit
No. Abs
1 0.000
2 0.001
3 0.002
Kinetics
:
::
:
Wavelength: 546.0nm
NO. Abs. T%
1 0.000 100.0%