IOM 686 AGZ 030A through 065A 11
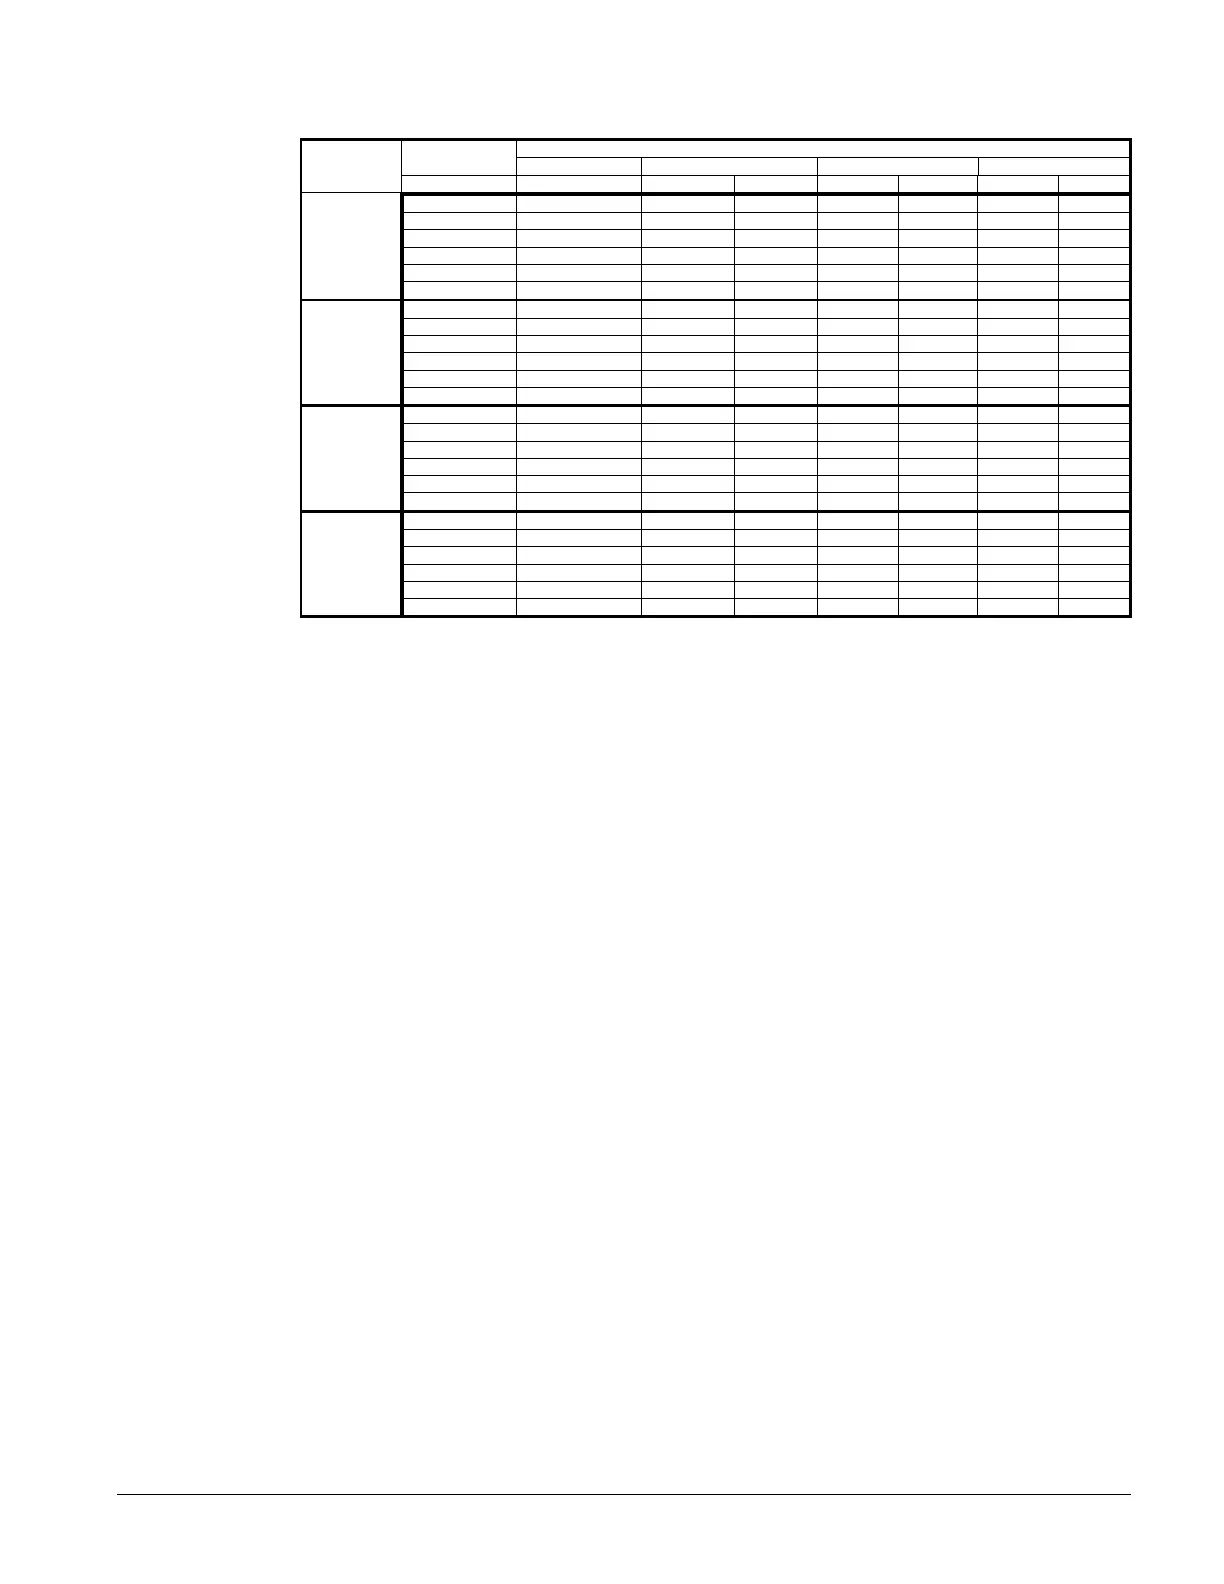
Table 6, Capacity and power derates
Chilled Water Fouling Factor
Delta-T 0.00025 (0.044) 0.00075 (0.132) 0.00175 (0.308)
ALTITUDE °F °C Cap. kW Cap. kW Cap. kW
6 3.3 0.992 0.995 0.996 0.982 0.911 0.935
8 4.4 0.995 0.997 0.969 0.984 0.914 0.937
SEA 10 5.6 1.000 1.000 0.975 0.986 0.919 0.939
LEVEL 12 6.7 1.005 1.002 0.980 0.989 0.923 0.941
14 6.8 1.010 1.005 0.985 0.991 0.928 0.943
16 8.9 1.014 1.007 0.989 0.993 0.930 0.944
6 3.3 0.978 1.005 0.957 0.990 0.903 0.943
8 4.4 0.982 1.007 0.961 0.993 0.905 0.945
10 5.6 0.986 1.009 0.965 0.995 0.909 0.947
2000 feet 12 6.7 0.992 1.011 0.970 0.998 0.914 0.949
14 6.8 0.997 1.014 0.973 1.001 0.919 0.952
16 8.9 1.000 1.016 0.975 1.002 0.921 0.953
6 3.3 0.966 1.016 0.944 0.999 0.894 0.951
8 4.4 0.969 1.018 0.947 1.001 0.896 0.953
10 5.6 0.973 1.021 0.952 1.005 0.900 0.956
4000 feet 12 6.7 0.978 1.025 0.956 1.008 0.904 0.958
14 6.8 0.982 1.027 0.959 1.011 0.909 0.960
16 8.9 0.986 1.028 0.961 1.015 0.911 0.961
6 3.3 0.953 1.025 0.930 1.009 0.884 0.961
8 4.4 0.955 1.028 0.934 1.011 0.887 0.962
10 5.6 0.959 1.031 0.939 1.013 0.890 0.964
6000 feet 12 6.7 0.963 1.034 0.942 1.017 0.895 0.966
14 6.8 0.968 1.036 0.946 1.020 0.899 0.968
16 8.9 0.972 1.037 0.949 1.024 0.902 0.969
Evaporator Water Flow and Pressure Drop
Evaporator flow rate must fall between the minimum and maximum values shown in the evaporator
pressure drop table on page 12.
Measure the chilled water pressure drop through the evaporator at factory installed pressure taps.
It is important not to include the effect of valves or strainers in these readings.
Varying chilled water flow through the evaporator while the compressor(s) are operating is not
recommended.
 Loading...