23
ATMOS 41
the app note How does the ATMOS 41 perform under below freezing and snowy conditions
(metergroup.com/atmos-41-perform-under-below-freezing-and-snowy-conditions) for more
information on ATMOS 41 performance in high-latitude winter.
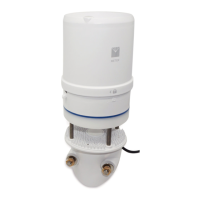
3.11.2 HEAVY RAIN AND STRONG WIND
During strong storm events, water can splash off of the horizontal bottom plate of the
anemometer envelope and interrupt the signal passing between the sonic transducers. The
spikes on the bottom plate help dissipate the energy of rainwater to minimize splashing and
reduce the likelihood that the wind measurements are interrupted. Additionally, specially
treated hydrophobic porous polyethylene membranes protect the ultrasonic transducers
from direct splashing and the sintered (porous) glass construction draws water from the
upper surface of the acoustic mirror to keep a constant sound path length. Despite these
features heavy rain and strong wind can still cause water to reach the membranes and
also cause temporary water buildup on the acoustic mirror. The hydrophobic nature of the
transducer protective membranes and the quick-draining ability of the acoustic mirror
should limit wind measurement interruptions to heavy rain events and should bring wind
measurement back online soon after extreme conditions abate.
3.11.3 ELECTROMAGNETIC INTERFERENCE
ATMOS 41 lightning and rainfall measurements can be adversely affected by high
level Electromagnetic Interference (EMI), such as that produced by high voltage power
transmission lines. Be sure to locate the ATMOS 41 far from such sources of EMI.
3.12 MEASUREMENTS WITH METER LOGGERS
METER EM60G and ZENTRA series data loggers query the ATMOS41 once every minute
and record the appropriate accumulations, averages, and maximums from the ATMOS41 in
memory. When the measurement interval is reached, the 1-min measurements are processed
into the appropriate accumulations, averages, and maximums and output to final storage
(see the logger manual for more information). Table 3 describes the quantities output from
the ATMOS41 and how they are processed in the logger for each ATMOS41 measurement.
Table 3 ATMOS41 output quantities processed in METER data logger
Measurement Data Output Every Minute
Data Saved by Logger Each
Measurement Interval
(
m = number of minutes)
Solar radiation
Average of six 10-s solar
radiation measurements
Average of
m 1-min averages of solar
radiation
Wind speed
Average of six 10-s wind
speed measurements in both
horizontal wind vectors
Wind run is calculated from each
1-min average of both horizontal wind
vectors. METER logger saves average
wind run from
m 1-min averages.