Insert new module for the Autolab 8-Series
24 | Page
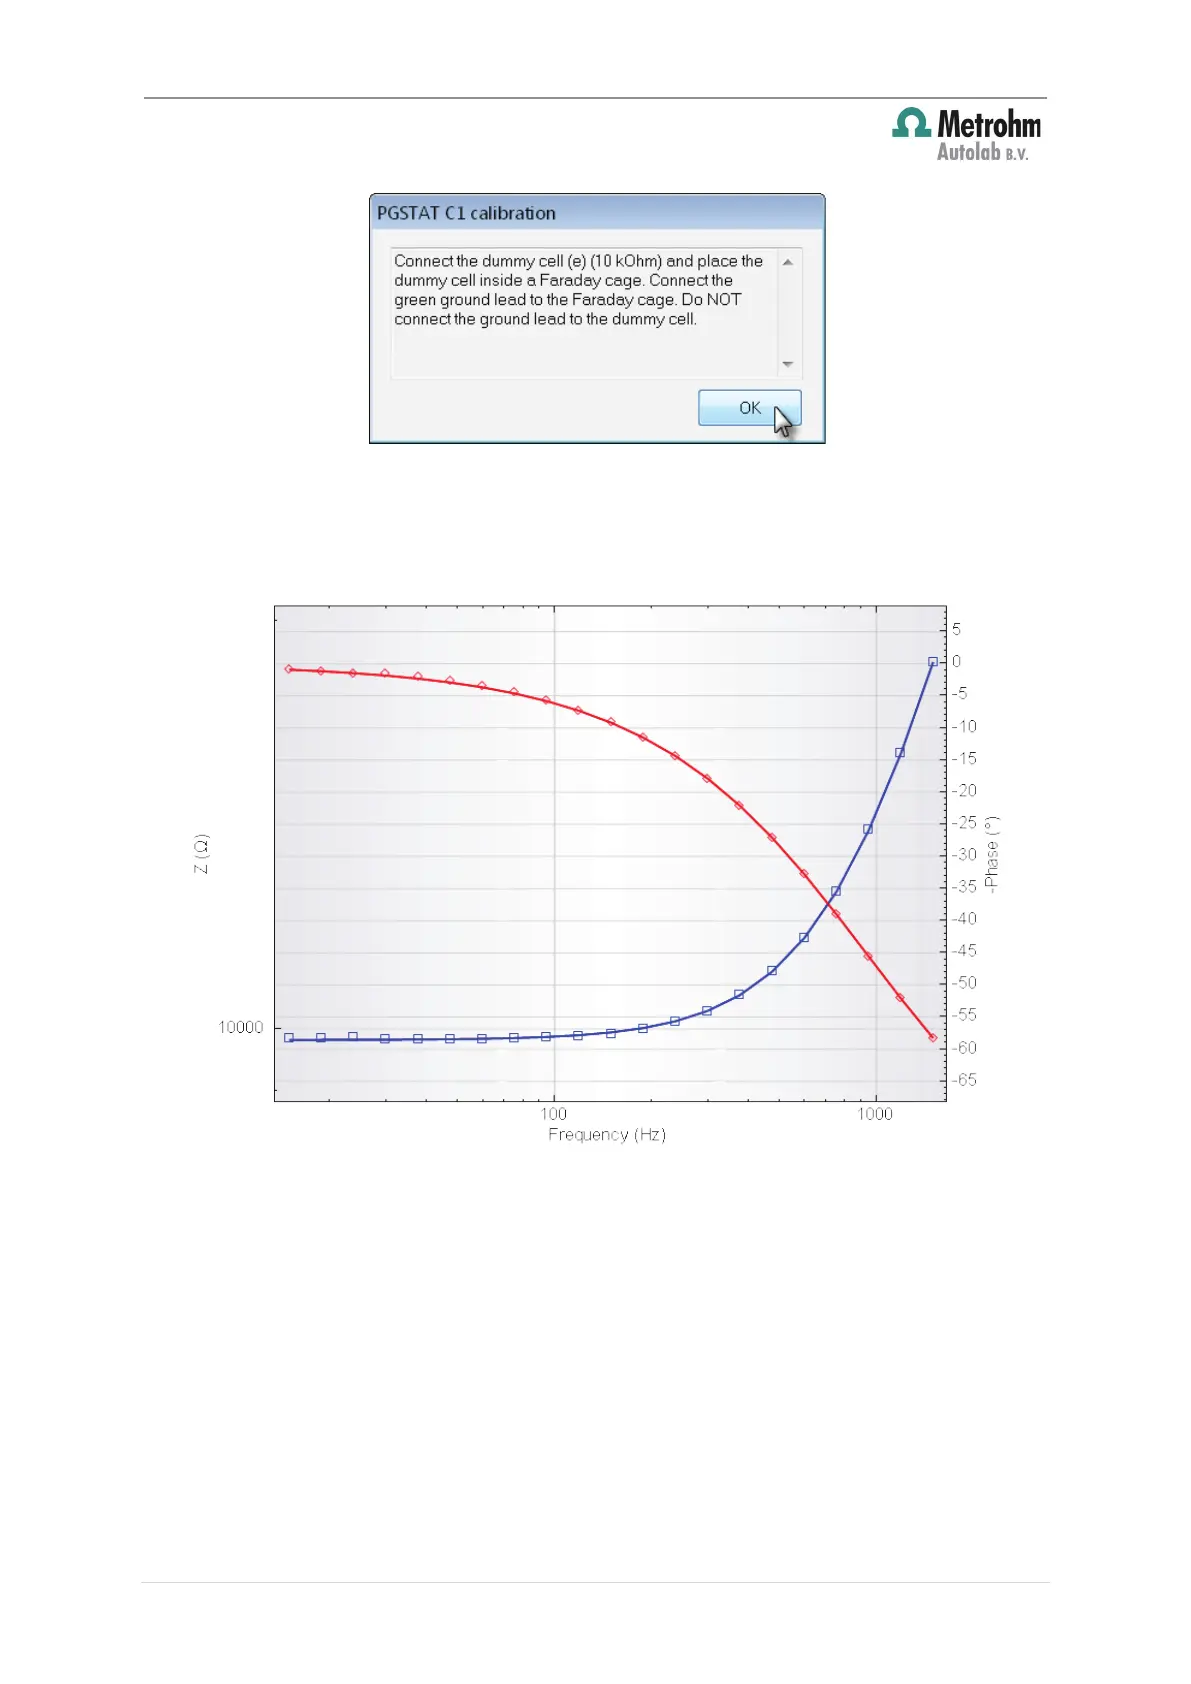
Figure 24 – A reminder message is shown at the beginning of the measurement
7. During the measurement, the measured data will be plotted as a Bode plot similar
to the example shown in Figure 25.
Figure 25 – Typical Bode plot obtained during the C1 calibration
8. The data is automatically fitted and the results of the fitting are reported in a
Message box at the end of the measurement (see Figure 26).
 Loading...