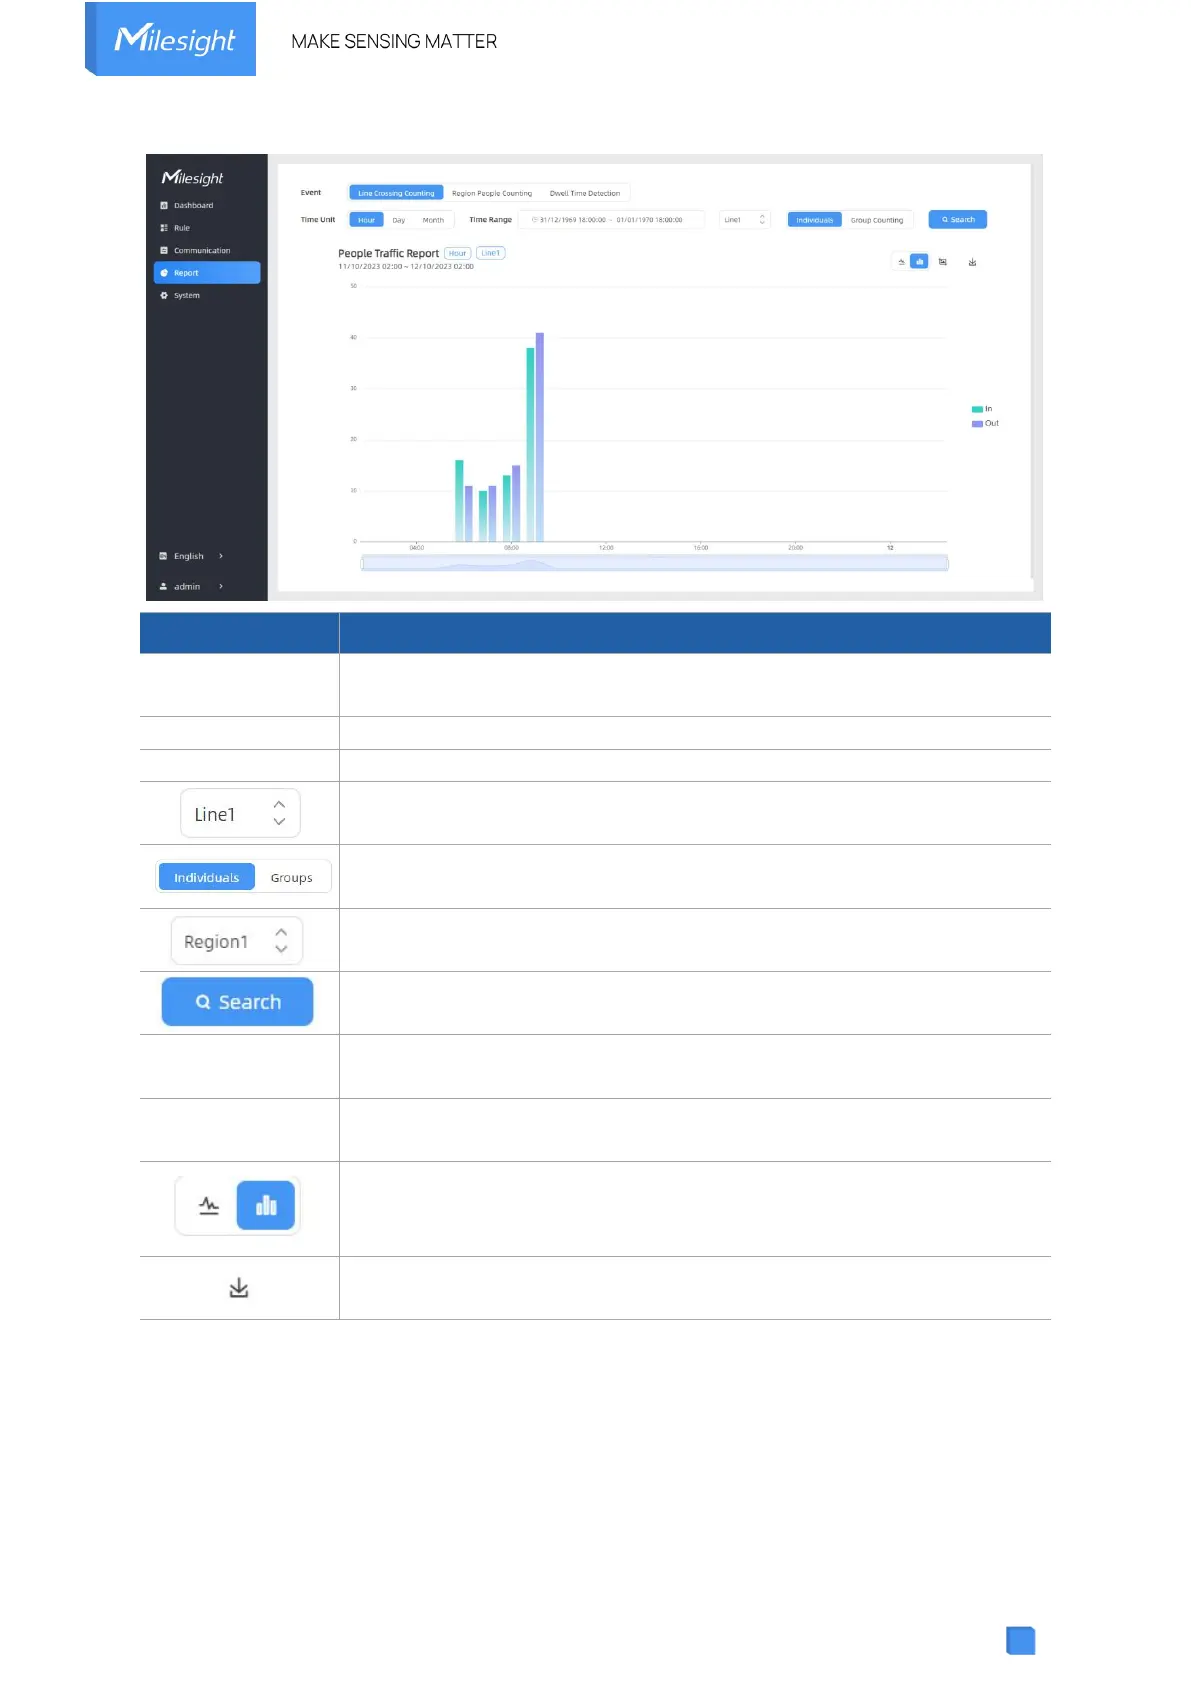
Select the event which you want to query the report. Line crossing
counting, region people counting and dwell time detection are optional.
Select the unit to generate the graph or export the data.
Select the time range to generate the graph.
Select the line to display the graph.
Select the individuals counting reports or groups counting reports.
Select the region to display the graph.
Click to generate the graph according to the time range and line option.
Export the historical traffic data as CSV file according to the selected time
unit. The device can store up to one million data records to CSV file.
Select whether to contain staff counting values on the graph.
Select the display type as line or bar.
Download the graph screenshot.