Description 4-9
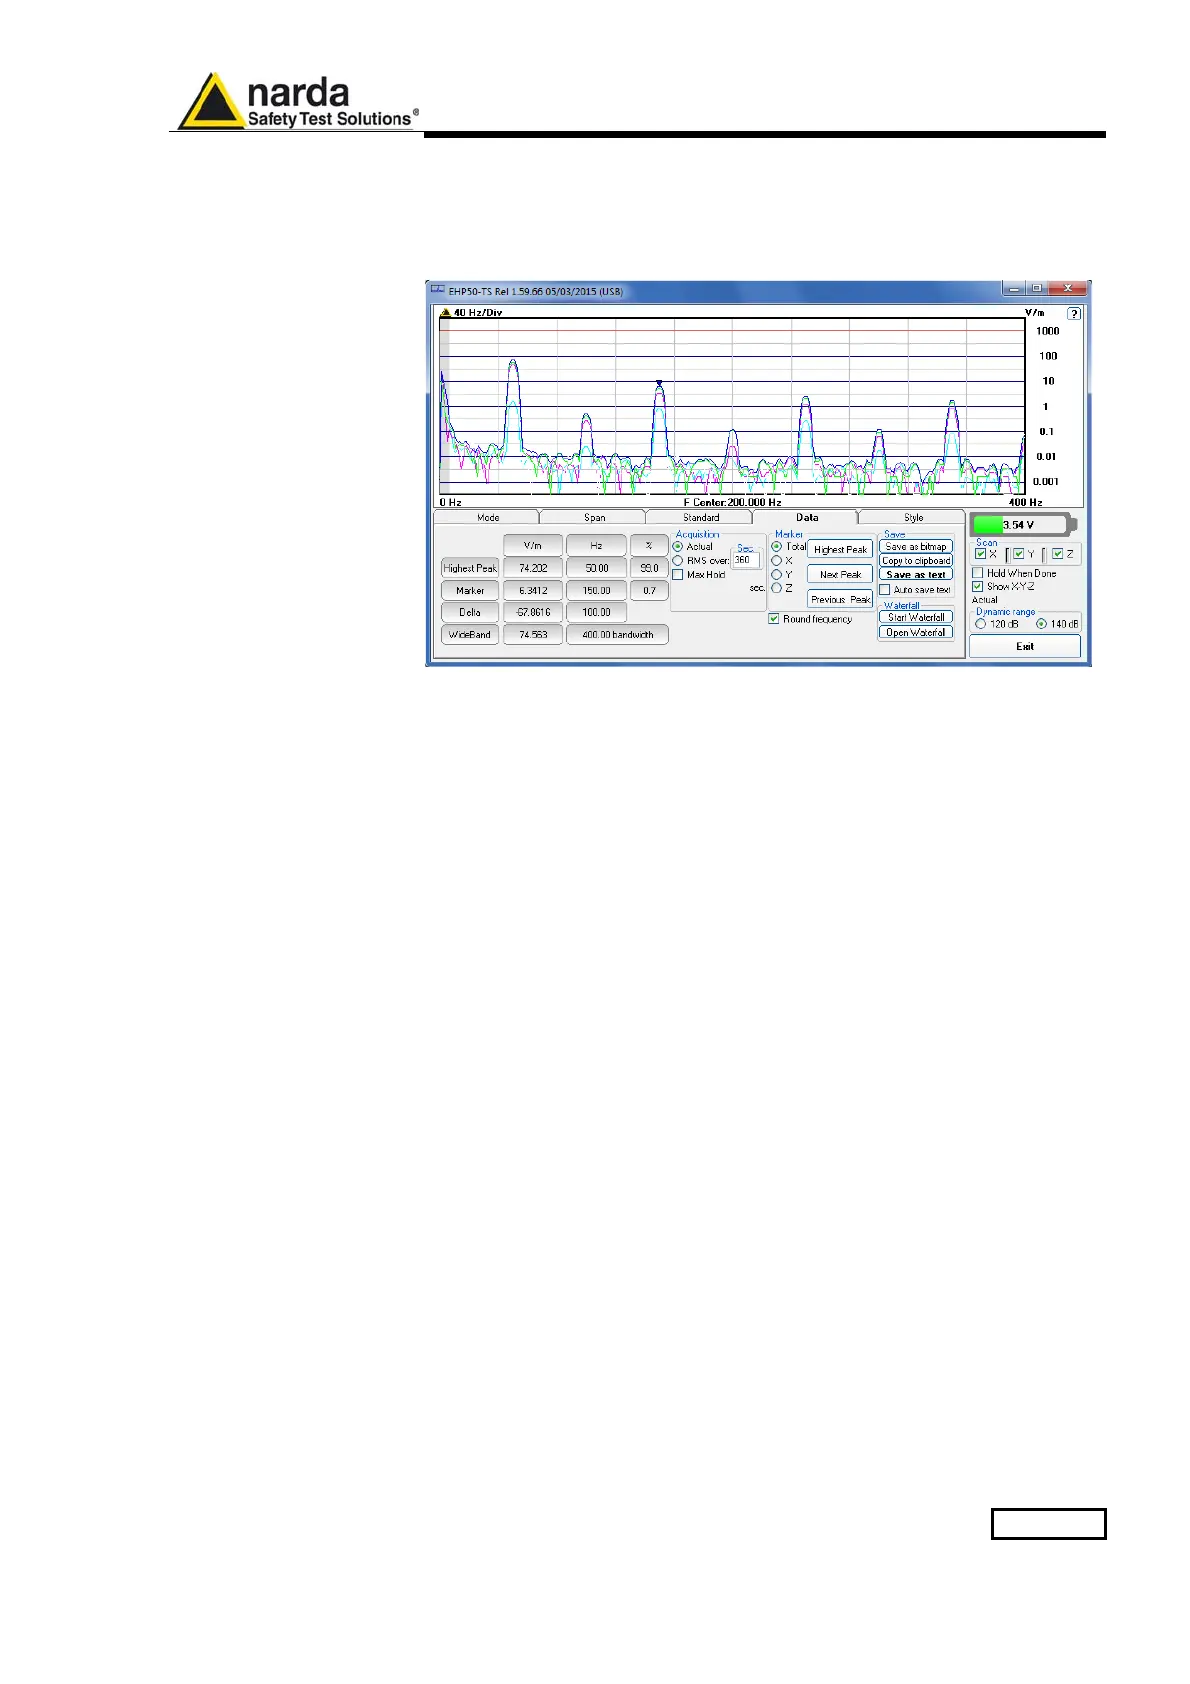
4.6 Data section
Even if EHP-50G takes measurement over the entire selected span, shown
results are related to the displayed spectrum only, allowing thus detailed
evaluation of user defineable frequency range through the zoom function.
Fig.4-4 Data section
The gray band on the left side of the graph highlights signals below the
minimum start frequency (1,2 % of Span) which are affected by residual
0 Hz peak. Calculation of Wideband result does not include any spectral
line within the gray band.
Measurement result: the following values are shown in a table form:
Highest Peak: Maximum value within the displayed spectrum.
Showed parameters:
Highest Peak field strength in the selected Unit (V/m in the above picture)
Highest Peak frequency (Hz)
% of contribution to the WideBand result
Marker: you can place a marker anywhere on the spectrum display with a
mouse click
Showed parameters:
Field strength at Marker frequency in the selected Unit (V/m in the above
picture)
Marker frequency (Hz)
% of contribution to the WideBand result
Delta: Difference in Field strength and frequency (Hz) between Highest
Peak and Marker
WideBand: integration over the displayed frequency band
It is the square sum of all contributions within the displayed spectrum.
Result of calculation is the field strength expressed in the selected unit
while “Bandwidth” is the difference between Stop and Start frequency.