EasyManuals Logo

NARDA EHP-50-G User Manual

NARDA EHP-50-G
92 pages
To Next Page IconTo Next Page
To Previous Page IconTo Previous Page
Page #43 background imageLoading...
Page #43 background image
Description 4-15
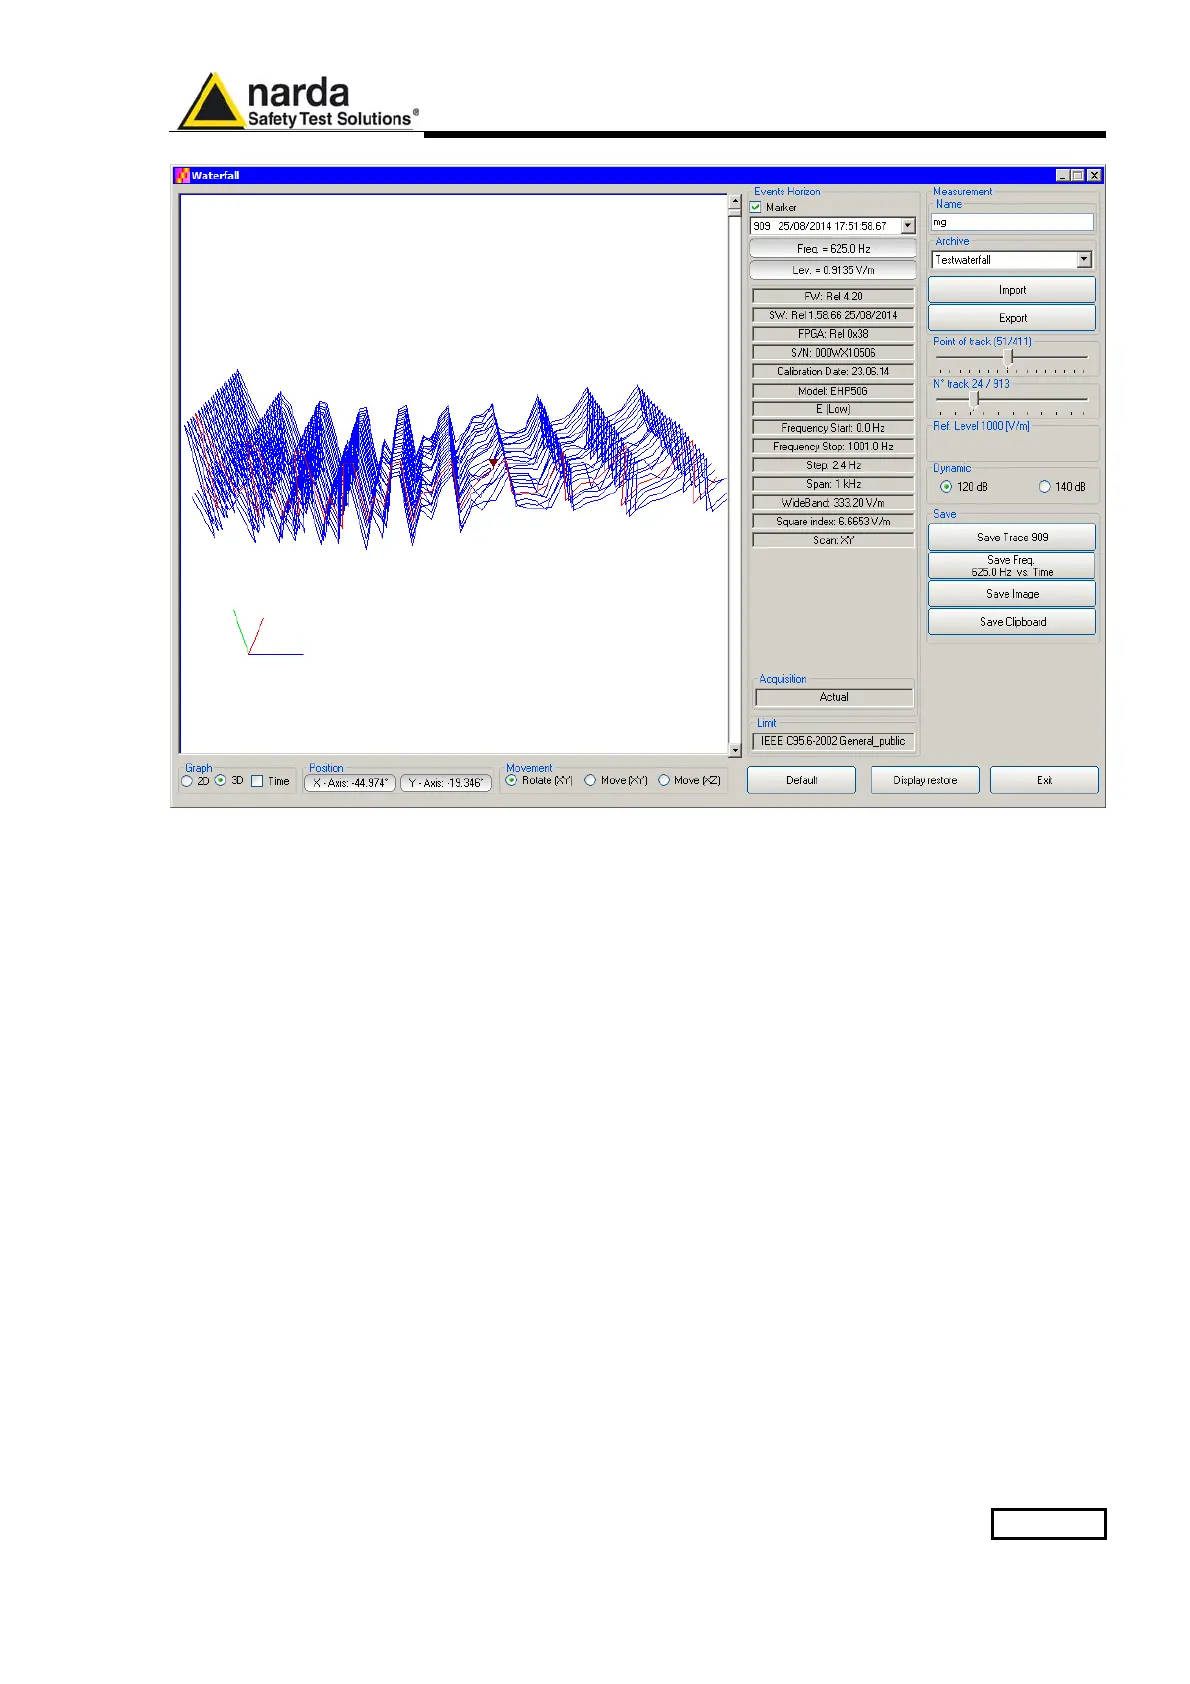
Fig.4-7 Waterfall - Graph 3D
In the Graph 3D, one axis (blue) represents Frequency, another the Level
(green) and the third the Time (red). So the Frequency can be on the
horizontal axis, the Level on the vertical axis and the Time in depth.
For this mode, another box, called Movement, will appear.
Selecting the appropriate functions, you can move, rotate or zoom the view
to your liking, using the mouse.

Questions and Answers:

Question and Answer IconNeed help?

Do you have a question about the NARDA EHP-50-G and is the answer not in the manual?

NARDA EHP-50-G Specifications

General IconGeneral
BrandNARDA
ModelEHP-50-G
CategoryMeasuring Instruments
LanguageEnglish

Related product manuals