Rev 01
|
GrowSphere MAX User Manual
133
|
Controller Operation
GrowSphere
Operating System
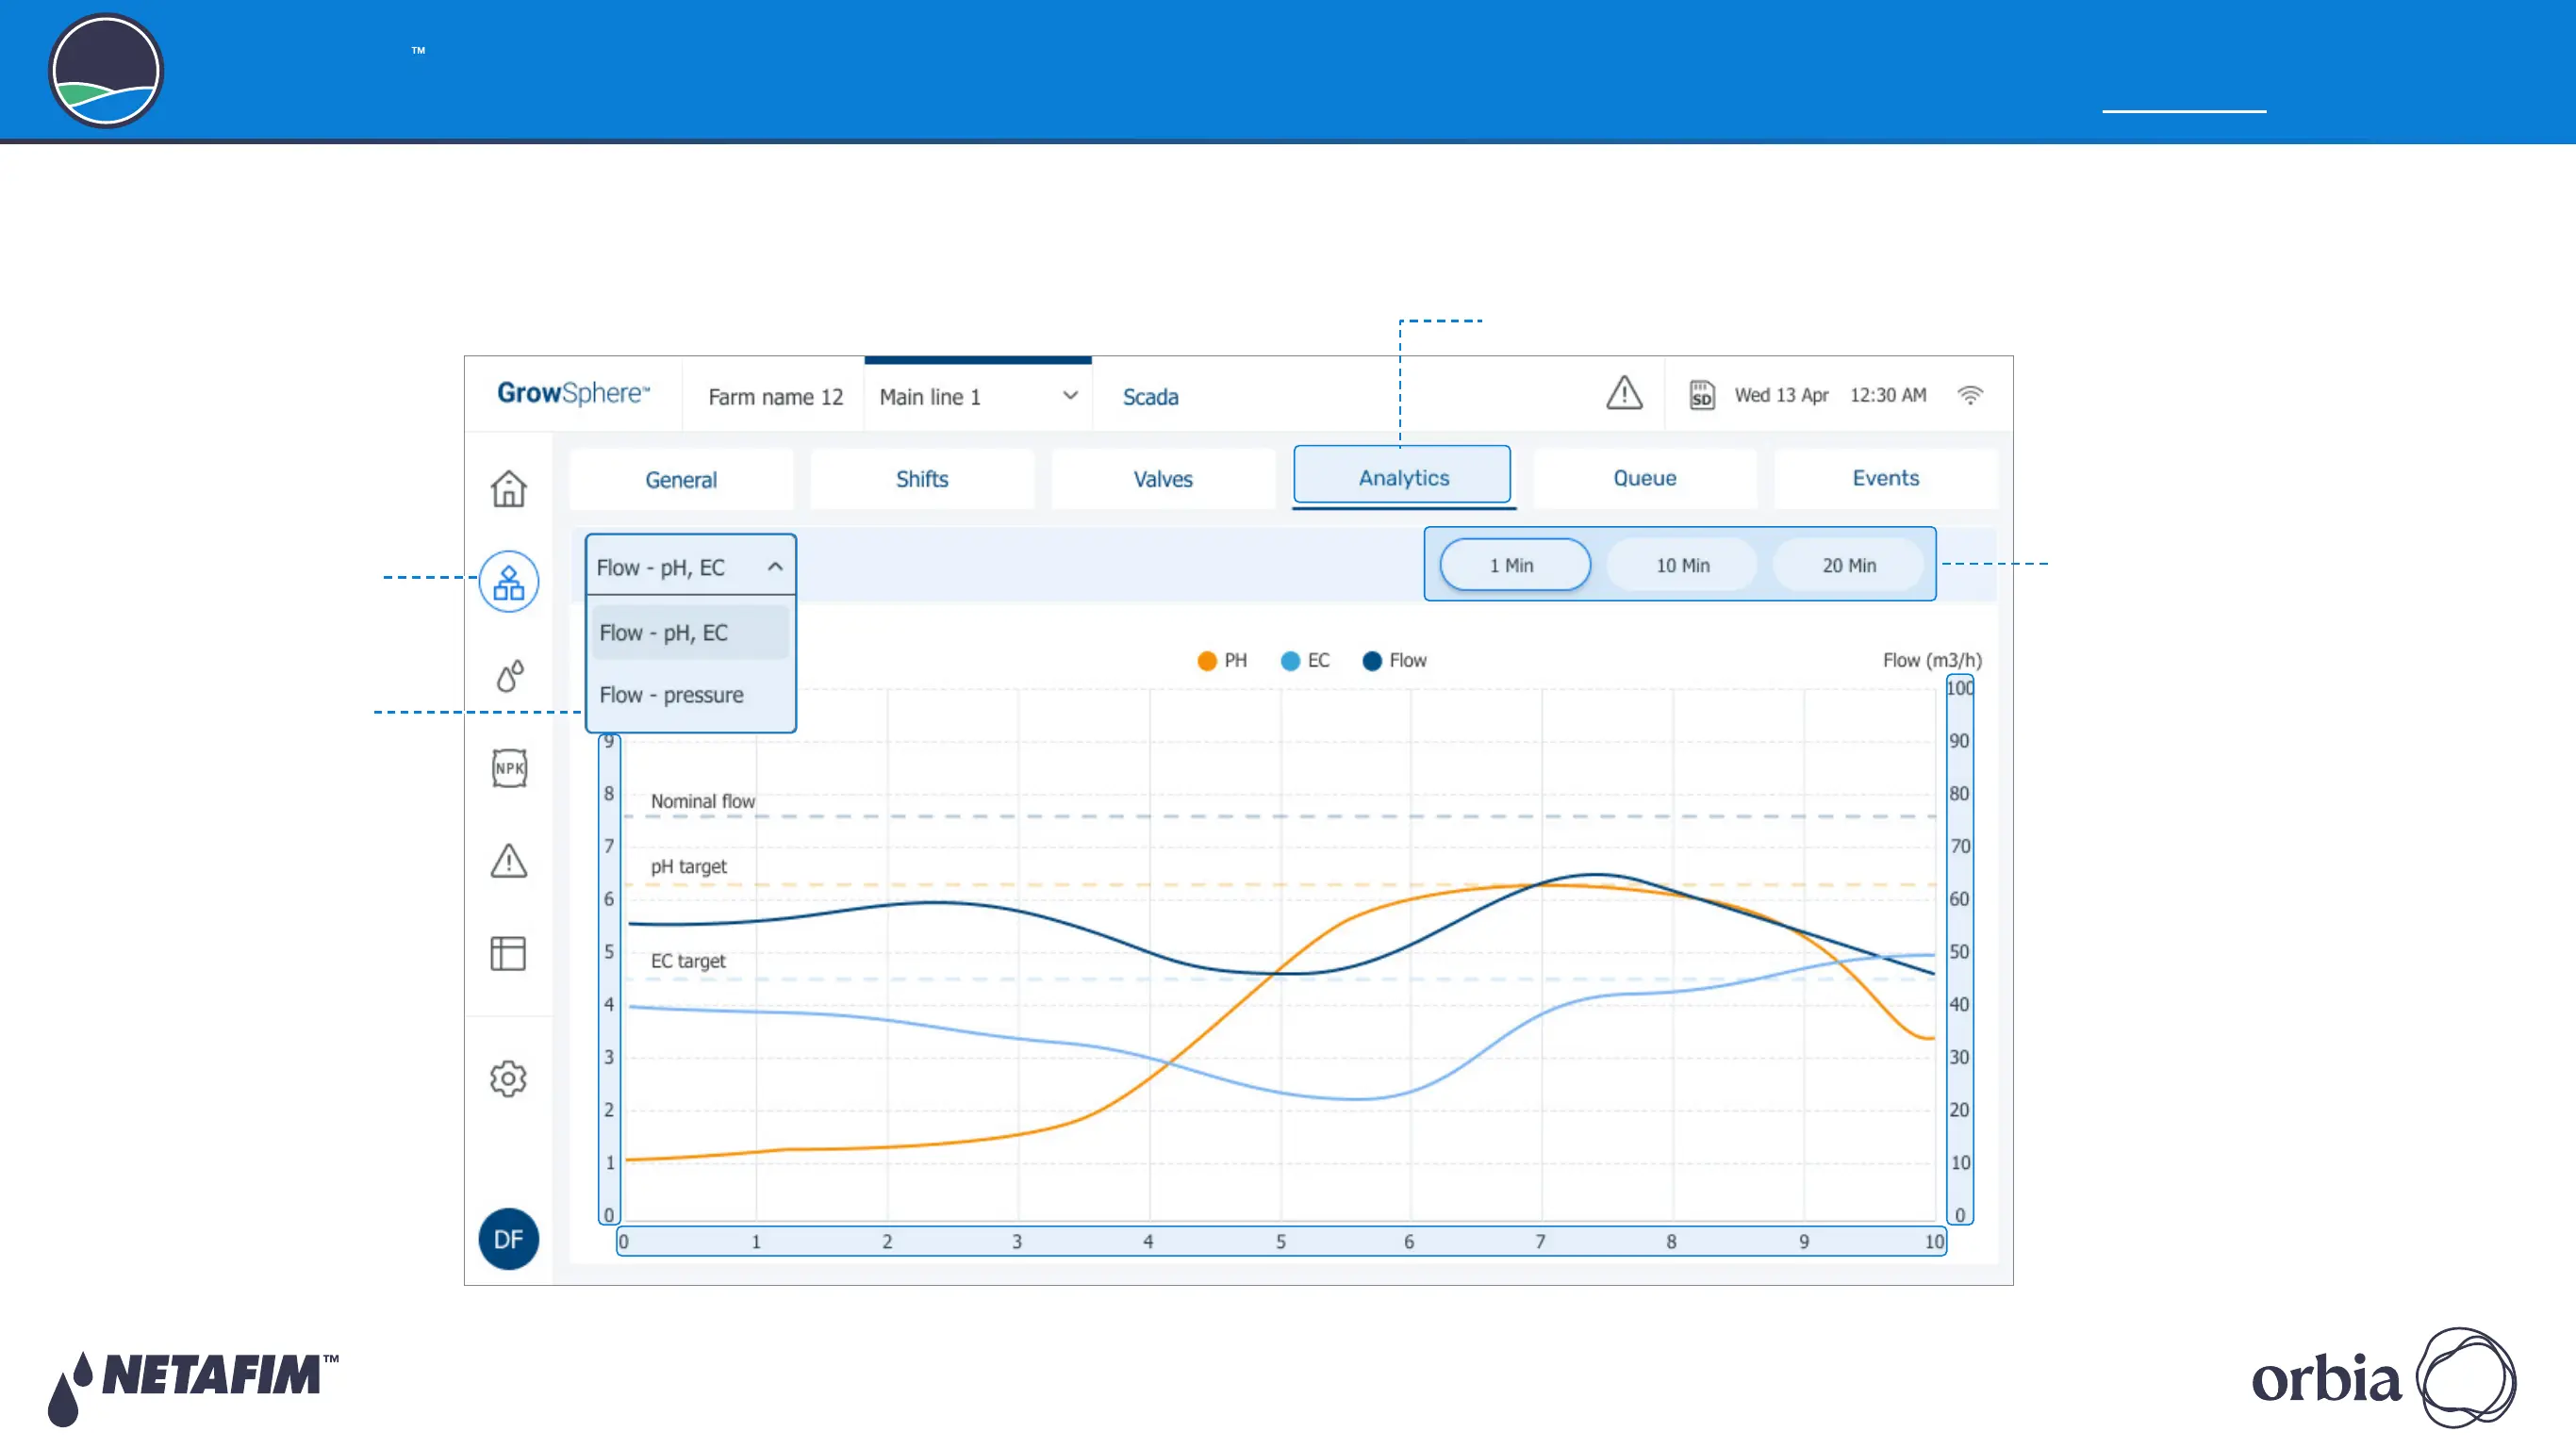
6.7.5 Irrigation Analytics
The Analytics tab displays a live graph representing the measurements of the sensors
connected to the analog inputs module. Perform the following steps to view and update the
graph:
3. Select the graph type
EC and pH measurements can
be displayed in relation to the
water flow.
Pressure can be displayed in
relation to the flow.
4. Select the timeline scale
Change the X-axis to display
the relevant time-line scale.
2. Tap the Analytics tab
1. Tap the SCADA button
 Loading...