11
Debugging
To actually see what is happening on the development board while the application is running, you must
set up a J-Link debugging session. SES has an integrated debugger that you can use to step through your
application.
1. Open your project in SES.
2. Select Debug > Go.
Alternatively, press F5.
The debugging interface looks like this:
By default, the application will break in main. You can set additional break points, single-step through
the application, read registers, and so on.
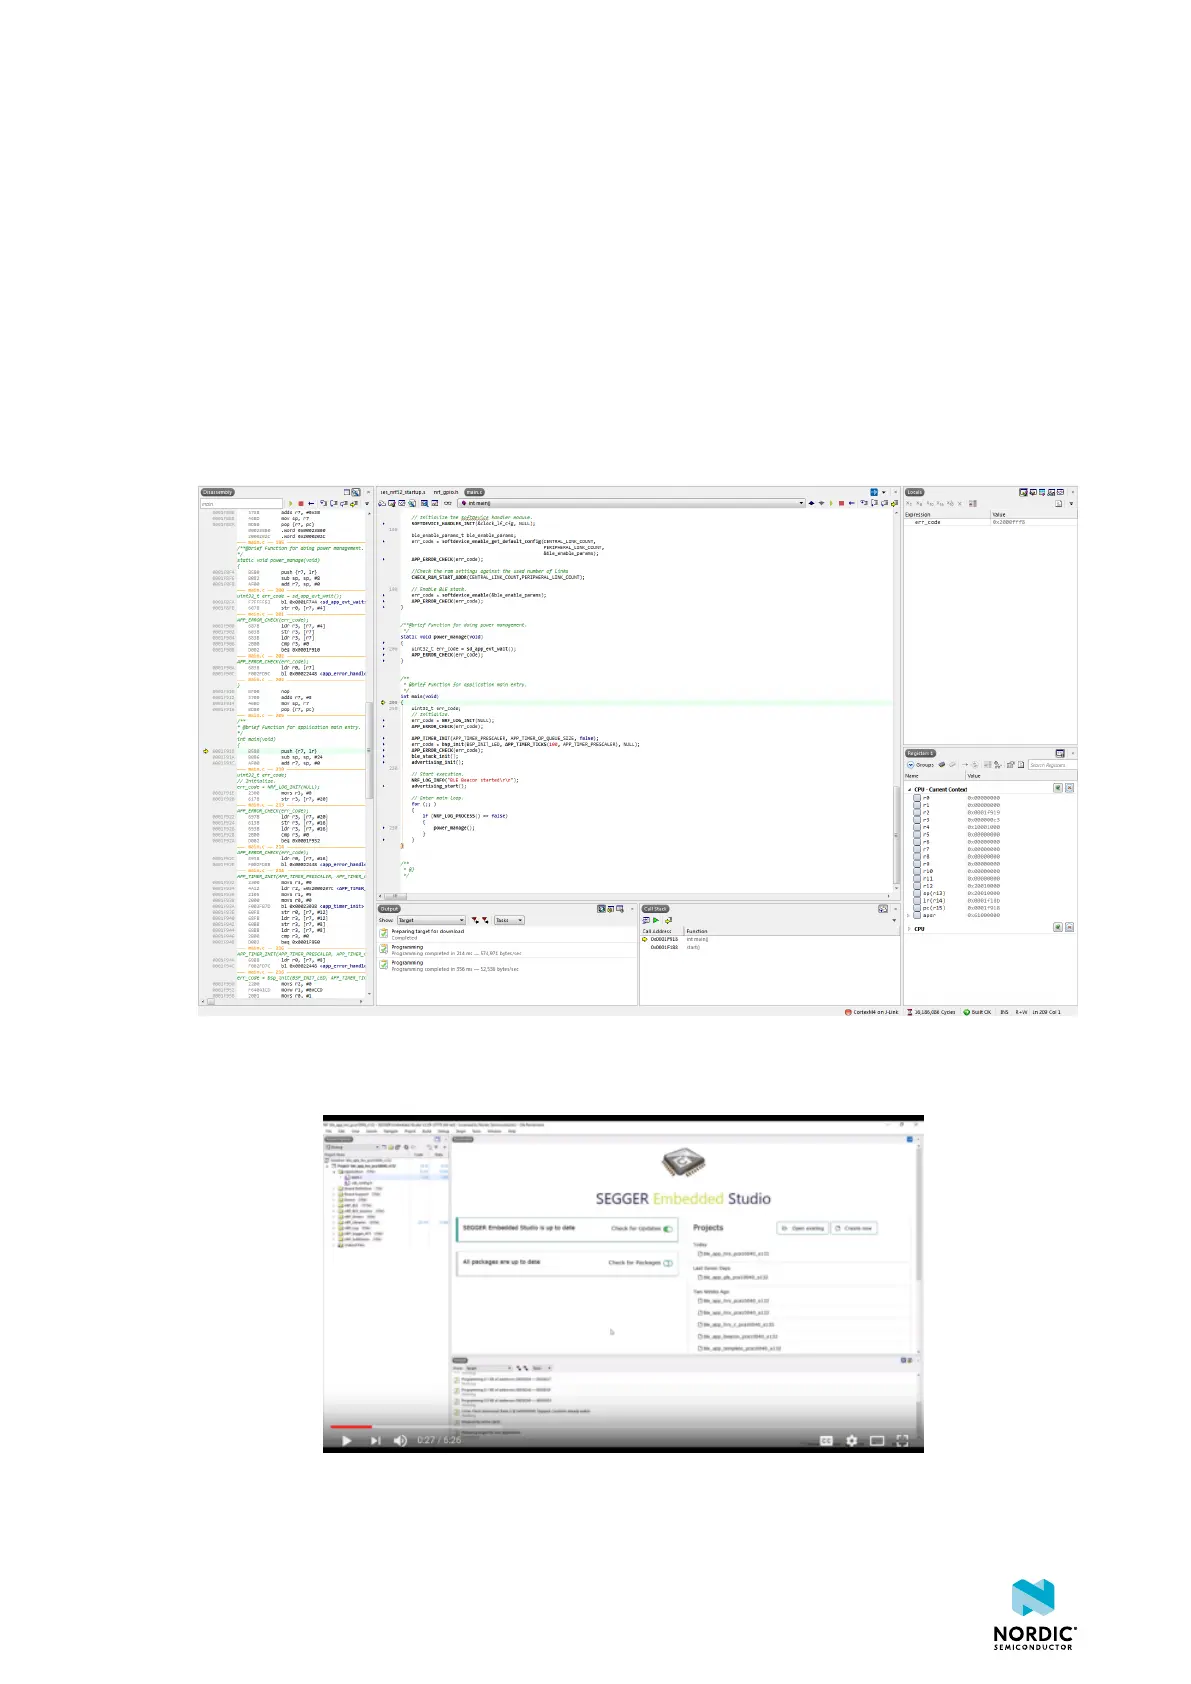
This video tutorial shows you how to use SES for debugging:
Figure 2: YouTube Tutorial
1159720_163 v1.1
33
 Loading...