7
1-3 Performance List
The following performance data list is the testing result of some popular benchmark testing
programs. These data are just referred by users, and there is no responsibility for different
testing data values gotten by users (the different Hardware & Software configuration will
result in different benchmark testing results.)
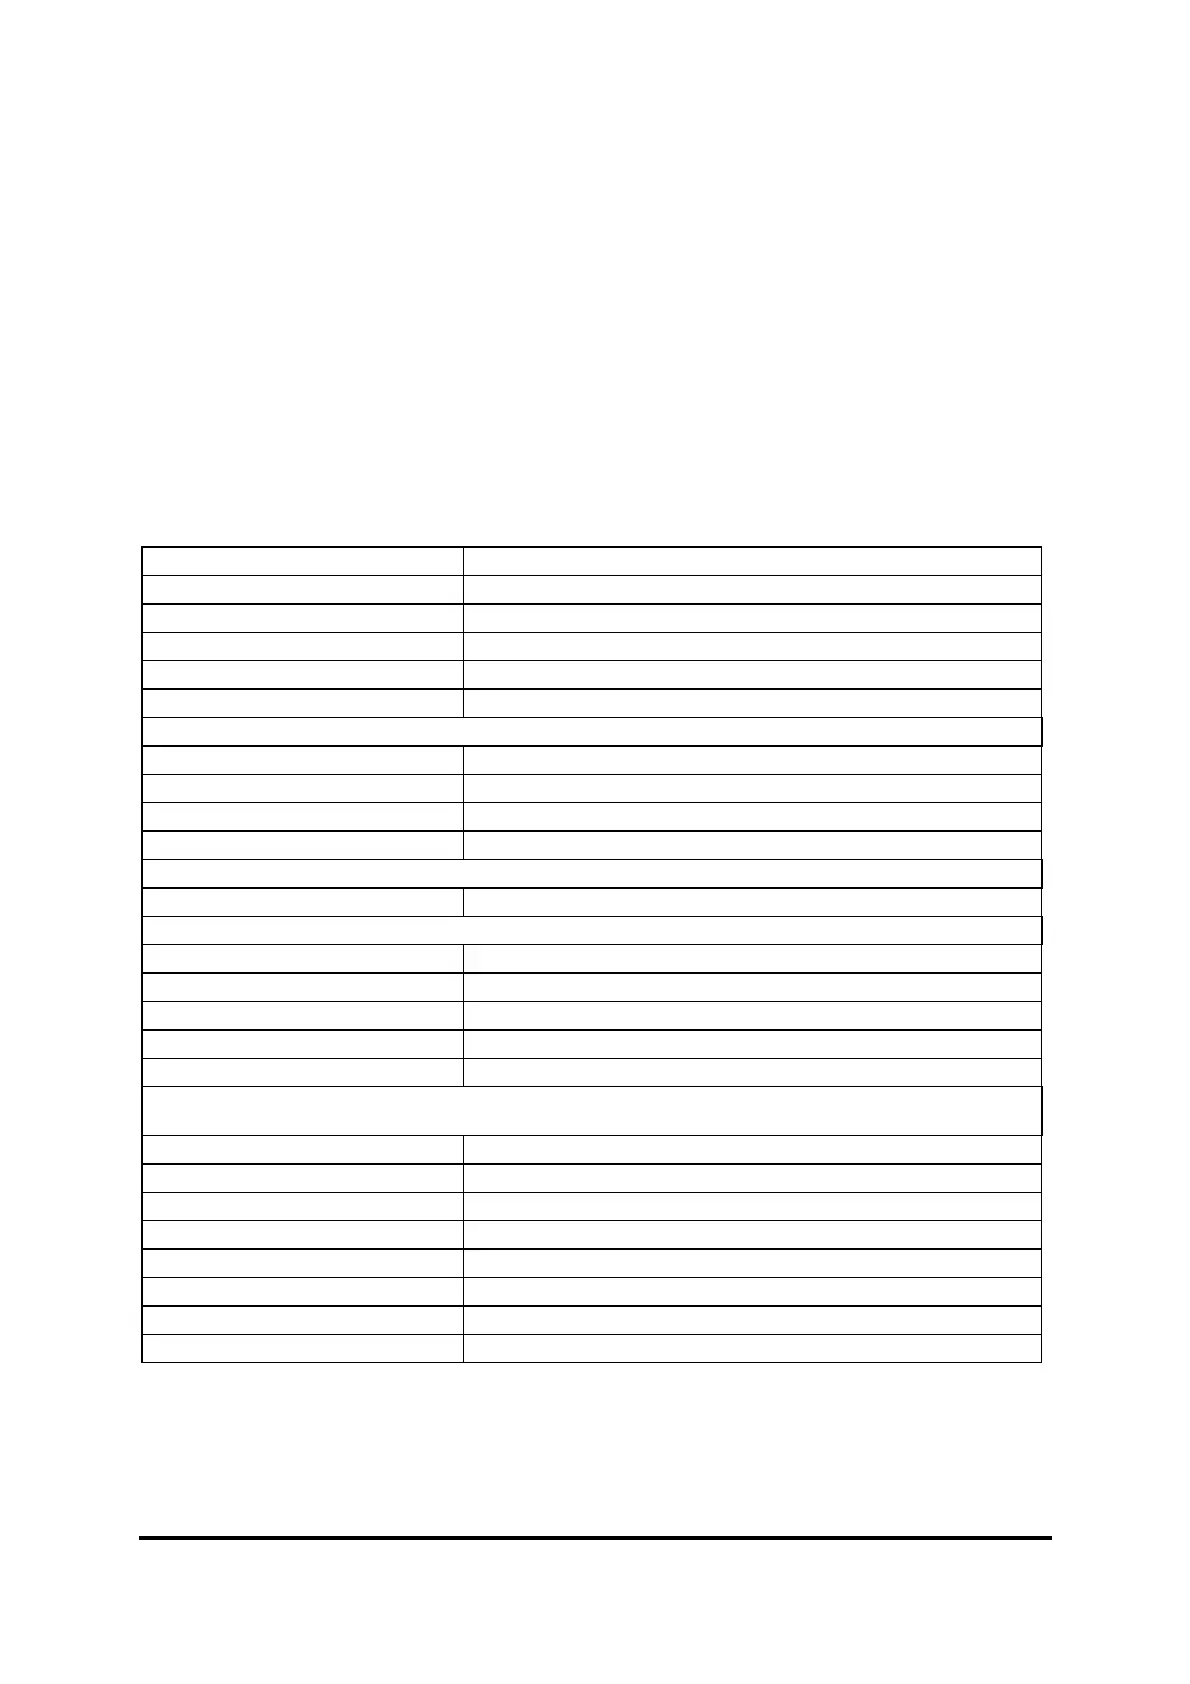
Performance Test Report
CPU: AMD Athlon 64x2 4800+
DRAM:
CORSAIR
512MB DDR2-800 Memory
VGA Card :
GeForce 6800XT 128
M (1024X768X32BIT Color)
Hard Disk Driver:
MAXTOR IDE 80GB
BIOS:
Award Standard default
OS:
Windows XP Professional (SERVICE PACK 2)
nForce MCP65S
3D Mark 2001SE
20942
3D Mark 2003
7861
3D Mark 2005
3040
3D Mark 2006
2137
AQUAMRK3 (GFX / CPU)
48884
PCMark2004
System / CPU / Memory
6370 / 6666 / 5179
Graph / HDD
4639/ 3971
Content Creation Winstone 2004
29.3
Business Winstone 2004
28.2
Winbench 99 V2.0:
Business/Hi-end Disk Winmark99
8140 / 33100
SISMark 2004: SISMark Rating(Internet Content Creation / Office Productivity )
SISMark 2004
180
197 / 164
3D Creation / 2D Creation
186 / 242
/ Web publication
169
Communication / Document
158 / 181
/ Data Analysis
155
SISOFT Sandra 2004 : 1.CPU Arithmetic Benchmark 2.Memory bandwidth Benchmark 3.CPU
Multi-Media Benchmar
1.Dhrystone ALU MIPS
7989
Whetstone FPU iSSE2 FLOPS
6761
2.Int/Float Buffered MB/S
4931 / 4896
3.Integer/Floating-Point IT/S
20776 / 22512
UT2003 Benchmark
59.26 / 36.66
Quake3 DEMO1 / FPS
11.2
Super Pi (1M) Second
201.1 / 315.8 / 2212.0
CPUZ System / CPU Clock 200.9 / 315.8 / 2210.2