54
NO. OF
SEGMENTS
DISPLAY AS SEEN BY DIVER
15
14
13
12
11
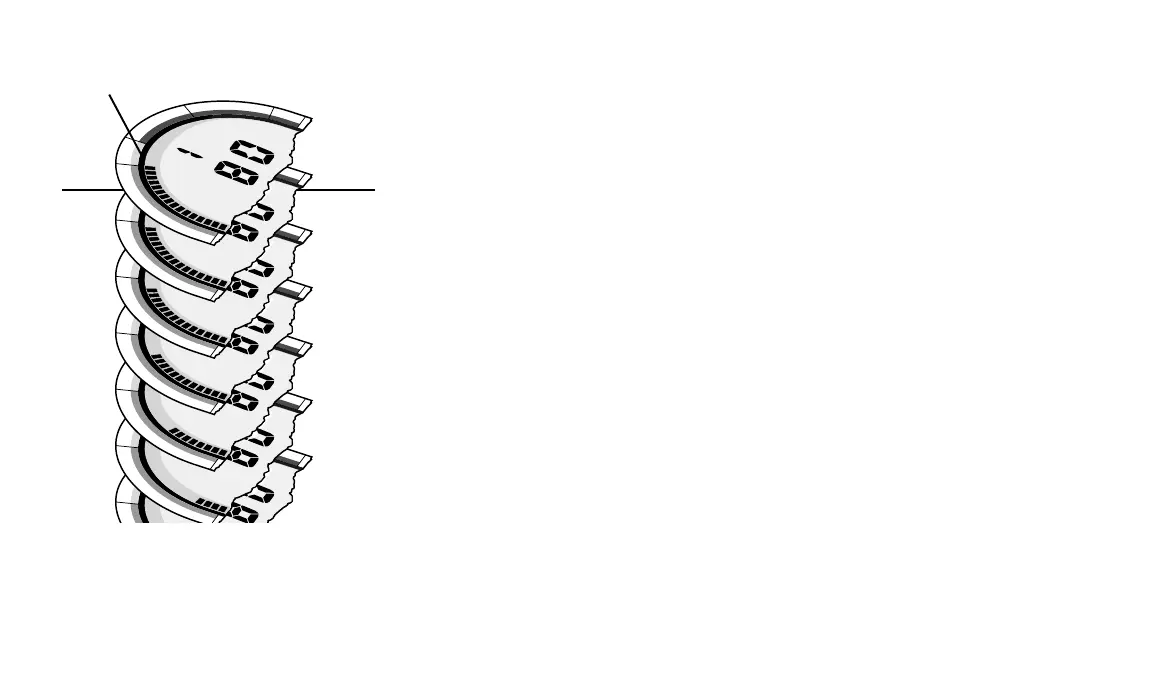
MULTIPLE TISSUE TRACKING
The DataMax Pro tracks twelve tissues compartments with half-times
ranging from 5 to 480 minutes. The Tissue Loading Bar Graph always
displays the controlling compartment that is the only one important at that
time. Think of the Tissue Loading Bar Graph as twelve separate transparent
displays laid on top of one another (Fig. 36). The tissue compartment that
has filled up fastest is the only one the viewer can see from the top.
At any particular point, one tissue compartment may be absorbing nitrogen,
while another that was previously higher may be off-gassing. Figure 37
illustrates the point at which one compartment “hands over” control to
another at a different depth. Though two tissues were controlling the diver
at different depths, the Tissue Loading Bar Graph remains the same because
it displays only the highest loading of the 12 compartments.
As time goes on, or you reach a new depth, there may be sufficient off
gassing of the tissue compartments to reduce the number of all bar graph
segments. After the dive, the Tissue Loading Bar Graph reading that was
recorded at the end of the dive is recorded in the Dive Log.
REPETITIVE DECOMPRESSION DIVING
The decompression model used by the DataMax Pro is based on the no-
decompression multi-level repetitive dive schedules successfully tested by Dr.
Ray Rogers and Dr. Michael Powell. These tests did not include repetitive
C
Z
.
.
1
0
F
T
S
T
O
P
2
0
F
T
S
T
O
P
3
0
F
T
#
FT
N
O
D
E
C
O
M
C
Z
.
.
1
0
F
T
S
T
O
P
2
0
F
T
S
T
O
P
3
0
F
T
#
DEPTH FT
N
O
D
E
C
O
M
C
Z
.
.
1
0
F
T
S
T
O
P
2
0
F
T
S
T
O
P
3
0
F
T
#
DEPTH FT
N
O
D
E
C
O
M
C
Z
.
.
1
0
F
T
S
T
O
P
2
0
F
T
S
T
O
P
3
0
F
T
#
DEPTH FT
N
O
D
E
C
O
M
C
Z
.
.
1
0
F
T
S
T
O
P
2
0
F
T
S
T
O
P
3
0
F
T
#
DEPTH FT
N
O
D
E
C
O
M
C
Z
.
.
1
0
F
T
S
T
O
P
2
0
F
T
S
T
O
P
3
0
F
T
#
DEPTH FT
N
O
D
E
C
O
M
C
Z
.
.
1
0
F
T
S
T
O
P
2
0
F
T
S
T
O
P
3
0
F
T
#
DEPTH FT
Fig. 36 – Think of the 12 tissues
as overlaid clear displays
showing only the maximum bar
graph reading reached
20
40
80
120
160
etc.
etc.
TISSUE
HALF-TIME