5
®
DataMax
PRO
®
N
O
D
E
C
O
M
C
Z
.
.
1
0
F
T
S
T
O
P
2
0
F
T
3
0
5000 40003000
T
I
M
E
T
A
N
K
A
S
C
E
N
T
4
0
#
LOG PLAN
DEPTH MAX
SURFACE BOTTOM
NO DEC AIR
PSI
FT
M
LOW BATT METRIC
ASCENDING TO THE SURFACE
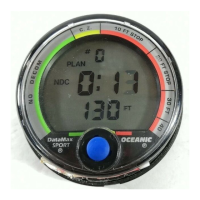
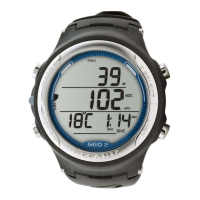
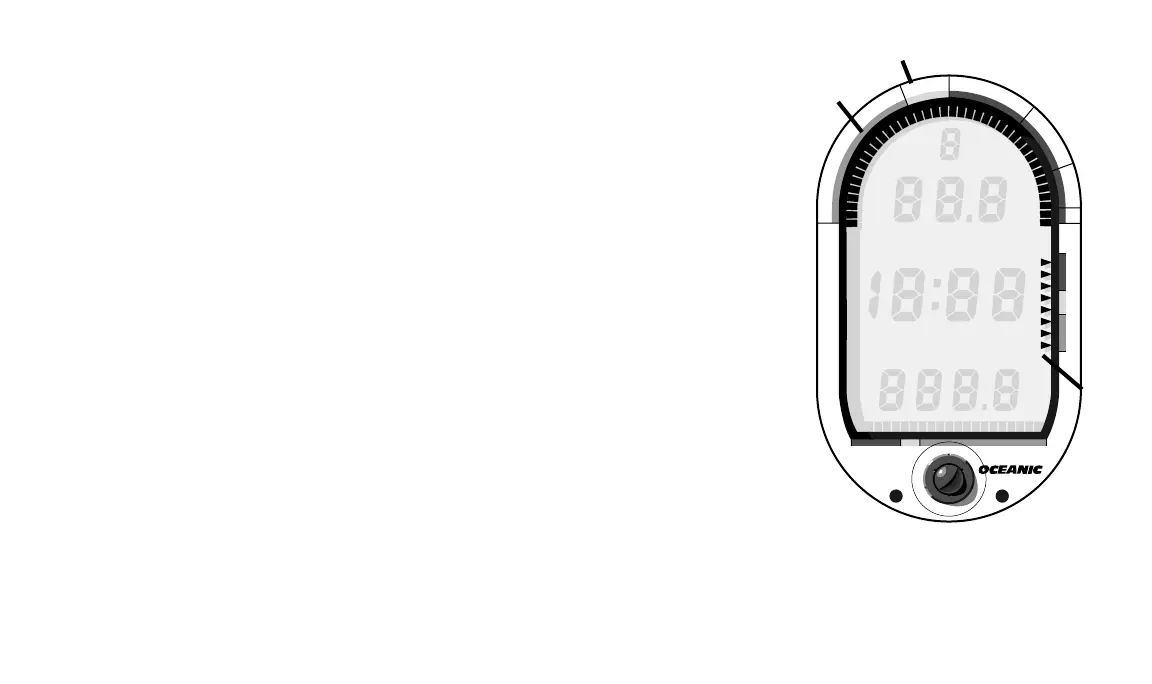
A graphic representation of nitrogen absorption can be seen in the
“Tissue Loading Bar Graph” (Fig 4a). This green, yellow, red bar graph
shows how close you are to the no-decompression limit. It “fills–up” with
segments as your depth and bottom time increase. Upon ascent to shallower
depths, the Tissue Loading Bar Graph will begin to recede, giving a visual
representation of nitrogen off–gassing. The TLBG also provides a way to
easily manage decompression by indicating three “ceiling” depths. This is
discussed fully in the “Handling the Extremes” section beginning page 30.
When rising towards the surface, the “Variable Ascent Rate Indicator”
(Fig. 4b) shows how fast you are ascending. The VARI will alert you with a
flashing display and audible alarm if you enter the red zone, indicating that
you have exceeded the prescribed maximum ascent rate and must slow down.
If you have not entered decompression, a safety stop made
between 15-20 feet is strongly recommended as a standard proce-
dure before completing your ascent. Many divers do this to provide a
wider zone of caution from the no-decompression limit. The Tissue Loading
Bar Graph gives a visual representation of just how close you came to the no-
decompression limit. The yellow “Caution Zone” (Fig. 4c) provides a further
visual indication of close proximity to decompression. This Caution Zone
portion of the TLBG allows you to make a decision regarding safety stop
duration or necessity. While you cannot provide a guarantee against
the occurrence of decompression sickness, you may choose your own
personal zone of caution based upon your individual age, physique,
Fig. 4 – Tissue Loading Bar
Graph and Variable Ascent
Rate Indicator
a.
b.
c.