Scenes and Tools
67
vector displayed on
screen, the step is 1%
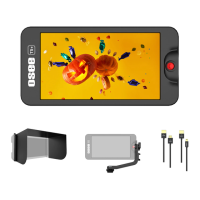
1. MULTI-SCOPES
This tool puts multiple analysis charts and the image together.
Activate Analysis Tools
Select
ANALYSIS
MULTI-SCOPES
tool and enable it
,
it will zoom
out to display the signal on the top left area, and show all common
used analysis tools including vector, histogram, waveform and audio
meter which are all activated. The layout of these tools on screen are
as shown in Figure 6.1-27:
Figure 6.1-27 Analysis Tools
Type & Density
You can choose different types for these charts through their
corresponding items in this tool, but their positions can’t be modified.
Adjust density of these tools all together through the
DENSITY
item.