R6000S Operation Manual: Rev. G
PAC L.P., All Rights Reserved, 2015 Page 27 of 92
1. CHAPTER ONE: INTRODUCTION
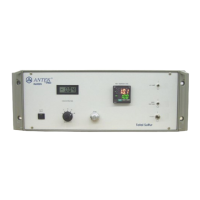
The PAC R6000S Sulfur in Carbon Dioxide Analyzer provides a safe, reliable automated system for the
detection and analysis of sulfur in carbon dioxide. The analyzer section uses a sample combustion and
UV fluorescent detection process to perform the analysis. System configuration, setup and manual
operation are achieved directly by the user through manual controls. All models of the analyzer are
available in either 115-VAC or 230-VAC power configurations.
1.1 Intended Audience
The content of this document must be read, understood and observed in all points and by each person
responsible for the preparation, transport, storage, installation, operation, maintenance, and repair of the
instrument, before starting to work with and on the instrument. This particularly applies to the safety
instructions in this manual.
1.2 Theory of Operation
The R6000S was designed as a flow-through analyzer. Solenoid valves are used to select whether zero
gas, span gas, or sample gas is directed to the pyrotube in the furnace where the sample is pyrolyzed
with an excess of oxygen, which converts all the components in the sample to permanent gases. Sulfur
compounds are broken down to sulfur dioxide (SO
2
), and any hydrocarbons are converted to carbon
dioxide (CO
2
) and water. A membrane dryer located between the furnace and the detectors in the gas
stream removes excess water. The pyrolyzed and dried gas stream enters the Sulfur Fluorescence
chamber where it is exposed to an ultraviolet source. When excited by the proper wavelength UV light
SO
2
will fluoresce and emit a specific wavelength of light. A filter lens allows only the appropriate
wavelength to reach the photomultiplier tube, which produces a current proportional to the amount of SO
2
being fluoresced.
The output of the photomultiplier tube is connected to a signal conditioning board, which converts it to a
usable indication of response. The sample stream is analyzed by generating a linear curve based on the
response of the zero gas compared to the response of the span gas and then plotting the sample’s
response on that curve. The response curve is adjusted each time the instrument is calibrated. Since
the response curve is based on the detector’s response, the calibration should be checked regularly to
ensure analytical accuracy.
Sensitivity of the detector can be affected by:
Sample flow rate; the higher the flow rate up to about 800 cc/min. -- the higher the sensitivity.
Ambient temperature; cooler temperatures increase the sensitivity and stability of the detector.
PMT high-voltage setting; the higher the voltage level the greater the sensitivity but the background
noise also increases.
The condition of the UV lamp; the greater the intensity of the UV light produced the better the
sensitivity.