Parker Hannifin
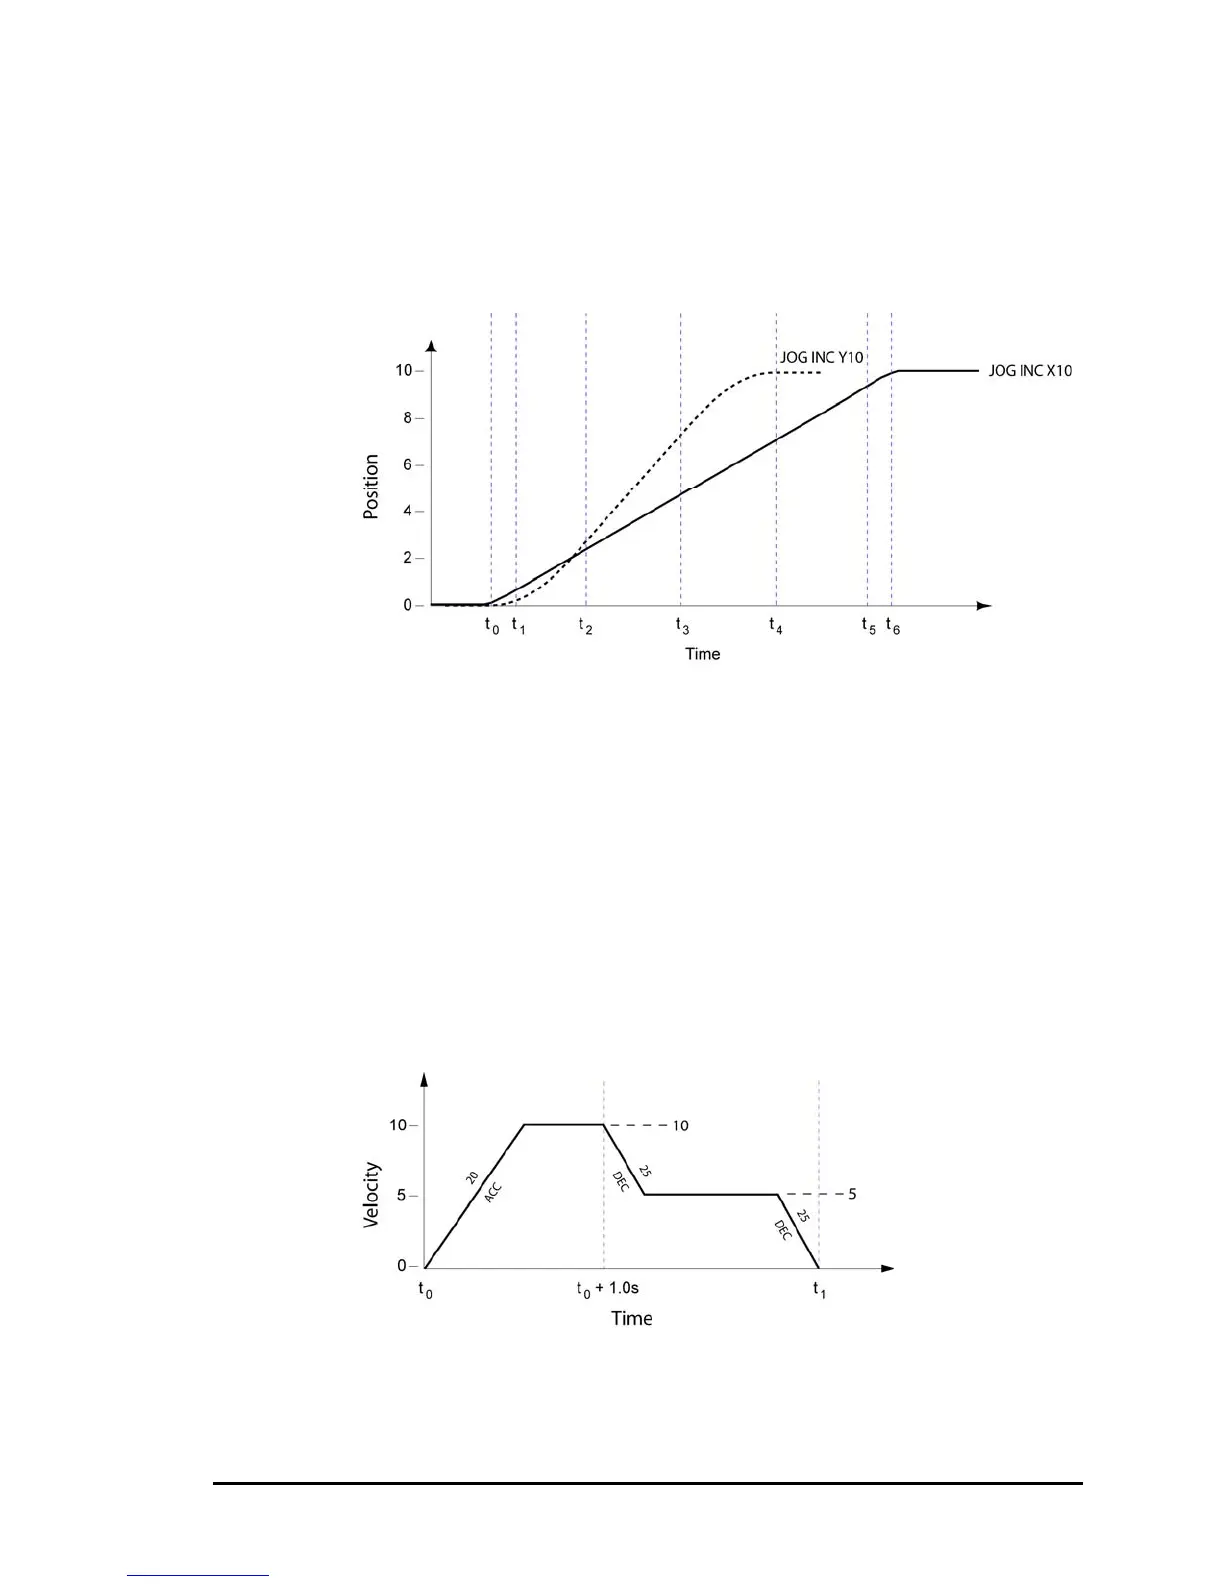
Figure 7 graphs the change in position for the X and Y axes. The Y axis is
dashed. The overall slope of the position curve for the Y axis is steeper,
reflecting its higher JOG VEL value (JOG VEL X25 Y50).
Comparing the first curve after t
0
for the axes show that a higher acceleration
value presents as a more gradual curve (JOG ACC X1000 Y500).
Figure 7 X and Y Position Motion Profiles
Example 2
The JOG VEL value is changed while a single axis is in motion (on the
fly (OTF)).
JOG ACC X20
JOG DEC X25
JOG VEL X10
JOG INC X10
DWL 1.0
JOG VEL X5
At one second (t
0
+ 1.0 sec.), the axis is commanded to decrease
speed to the new velocity. See Figure 8 for the velocity profile.
Motion ends at t
1.
Figure 8 Change in JOG VEL Value “On the Fly”
Making Motion 69

 Loading...