7
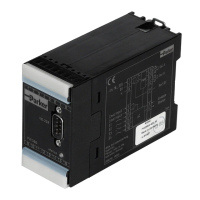
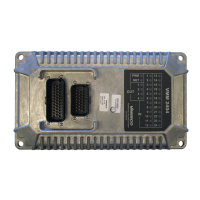
Digital Pump Control Module
Series PQDXXA-Z10
Installation and Setup Manual
Bulletin HY30-3255-INST/UK
Parker Hannifin Manufacturing Germany GmbH & Co. KG
Pump & Motor Division Europe
Chemnitz, Germany
Signal flow chart
+
–
–
+
if p
lst
>p
cmd
: I = off
if p
lst
<Integrator
Activation
*
p
cmd
: on
signal adaption
displacement
command
signal adaption
actual displace-
ment
signal adaption
actual pressure
signal adaption
pressure
command
PT
1
-filter
p
act
L
cmd
xL
fact
Q
max
=
ramp function
displacement
min. const.
I-lim
L
fact
in %
I-lim
I-act
I-switch
ramp function
pressure
commande horse po-
wer, (L
cmd
), 0...+10 V
command pressure,
(p
cmd
), 0...+10 V or
4...20 mA
command displace-
ment (Q
cmd
), 0...+10 V
or 4...20 mA
actual displacement,
(Q
act
), +9... +4 V
actual pressure,
(p
act
), 4...20 mA
or 0...+10 V
solenoid A displace-
ment control valve
solenoid B displace-
ment control valve
solenoid, pressure
pilot valve
PWM
dfreq
dampl
PWM
min.
max.
trigger
dfreq
dampl
const.
WQ
WP
WL
XL
XP
XQ
UQ
IQ:A
IQ:B
UP
I : P
PID
Q : P
Q : I
Q : D
PID
P : P
P : I
P : D
Control loop quality
Displacement control Closed loop pressure control
Deviation in Linearity <1.5% <2%
Hysteresis <1.5% <2%
The shown values are valid for components out of the delivery content and calibrated sensors.
 Loading...