Graphs.
11
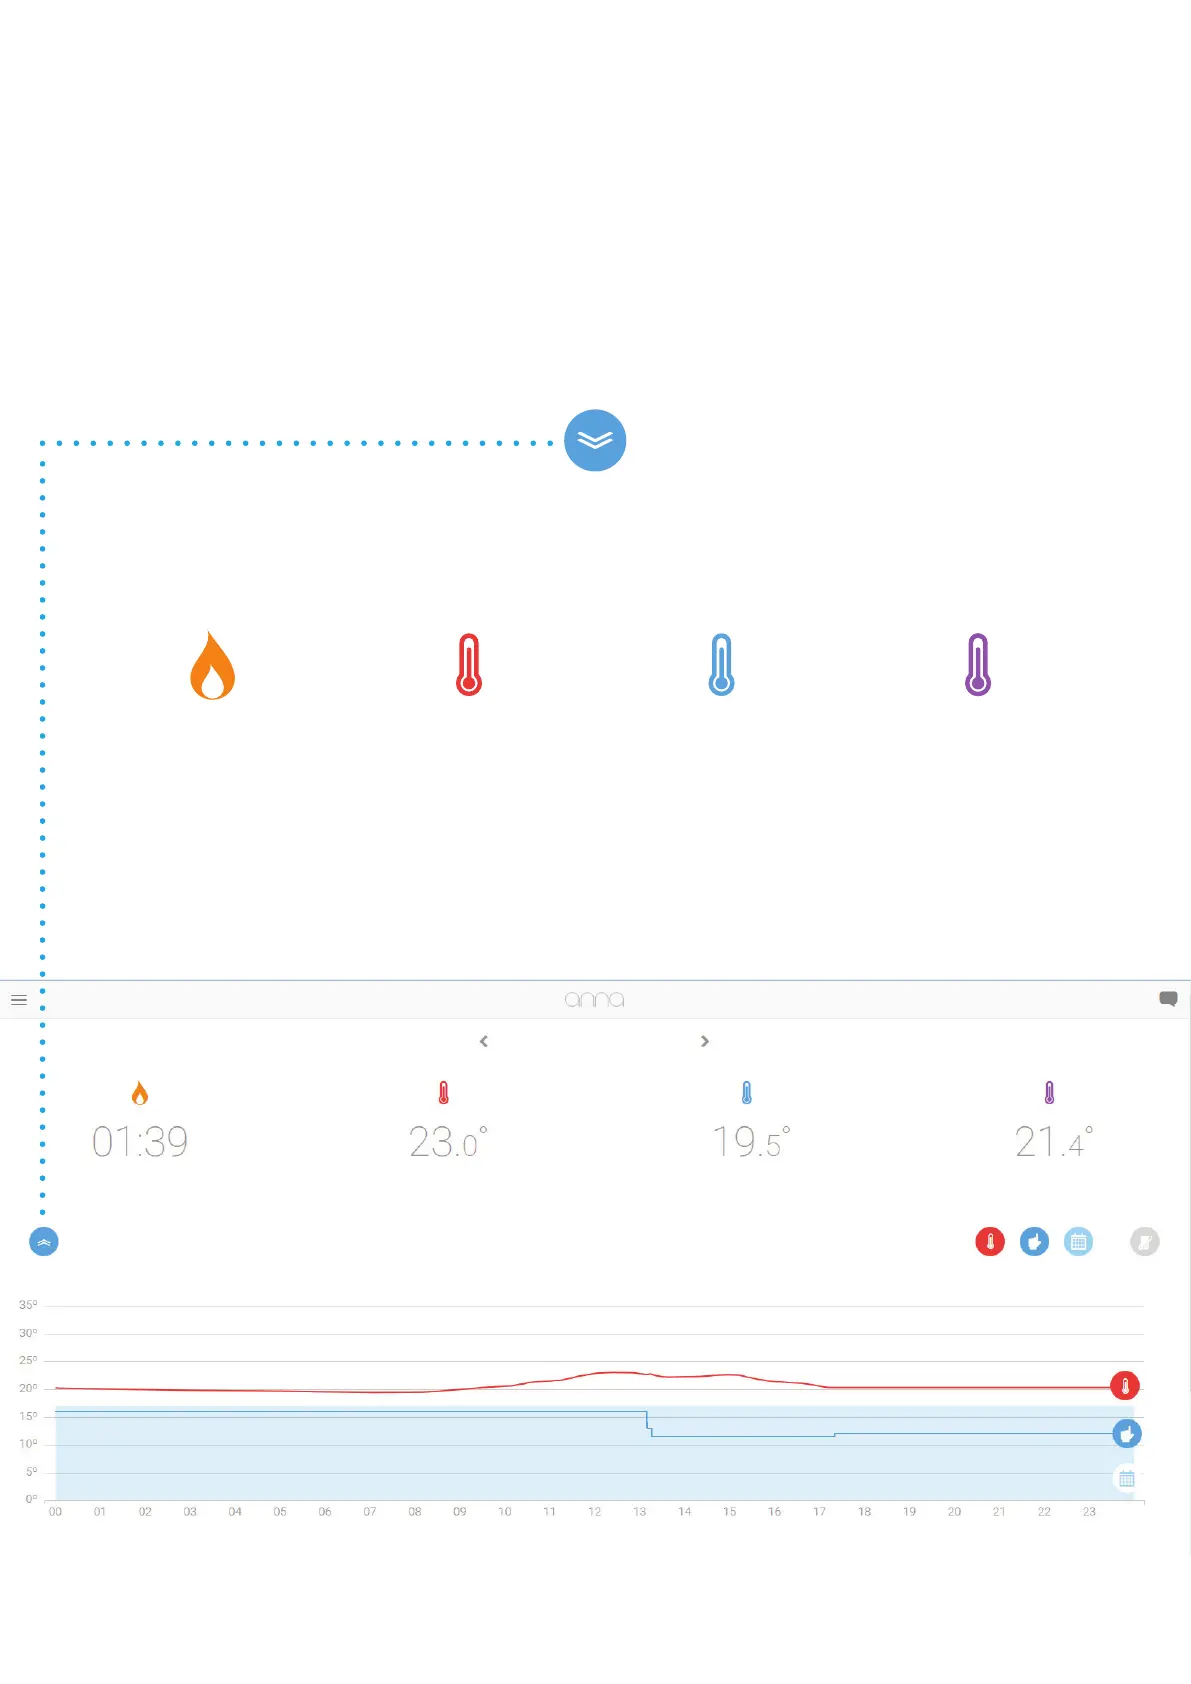
Besides graphs Anna offers more insight with the addition of
statistics in the HTML interface. The amount of burning hours, the
highest, lowest and average temperature are now available per day.
The amount of
measured burning
hours of the
selected day.
The highest
measured
temperature of the
selected day.
The lowest
measured
temperature of the
selected day.
The average
measured
temperature of the
selected day.
w n rmre
upde 1.1.3
Click on the icon on the left to view the statistics of the selected day.
Burn hours Highest Lowest Average
18 december 2015