PQR
Series Model D52
Page 22
www.Powertronics.com
V2.1
Data Log Graph
Select the Plot Time History selection under Graph
Select 1 or 2 of the available channels to graph
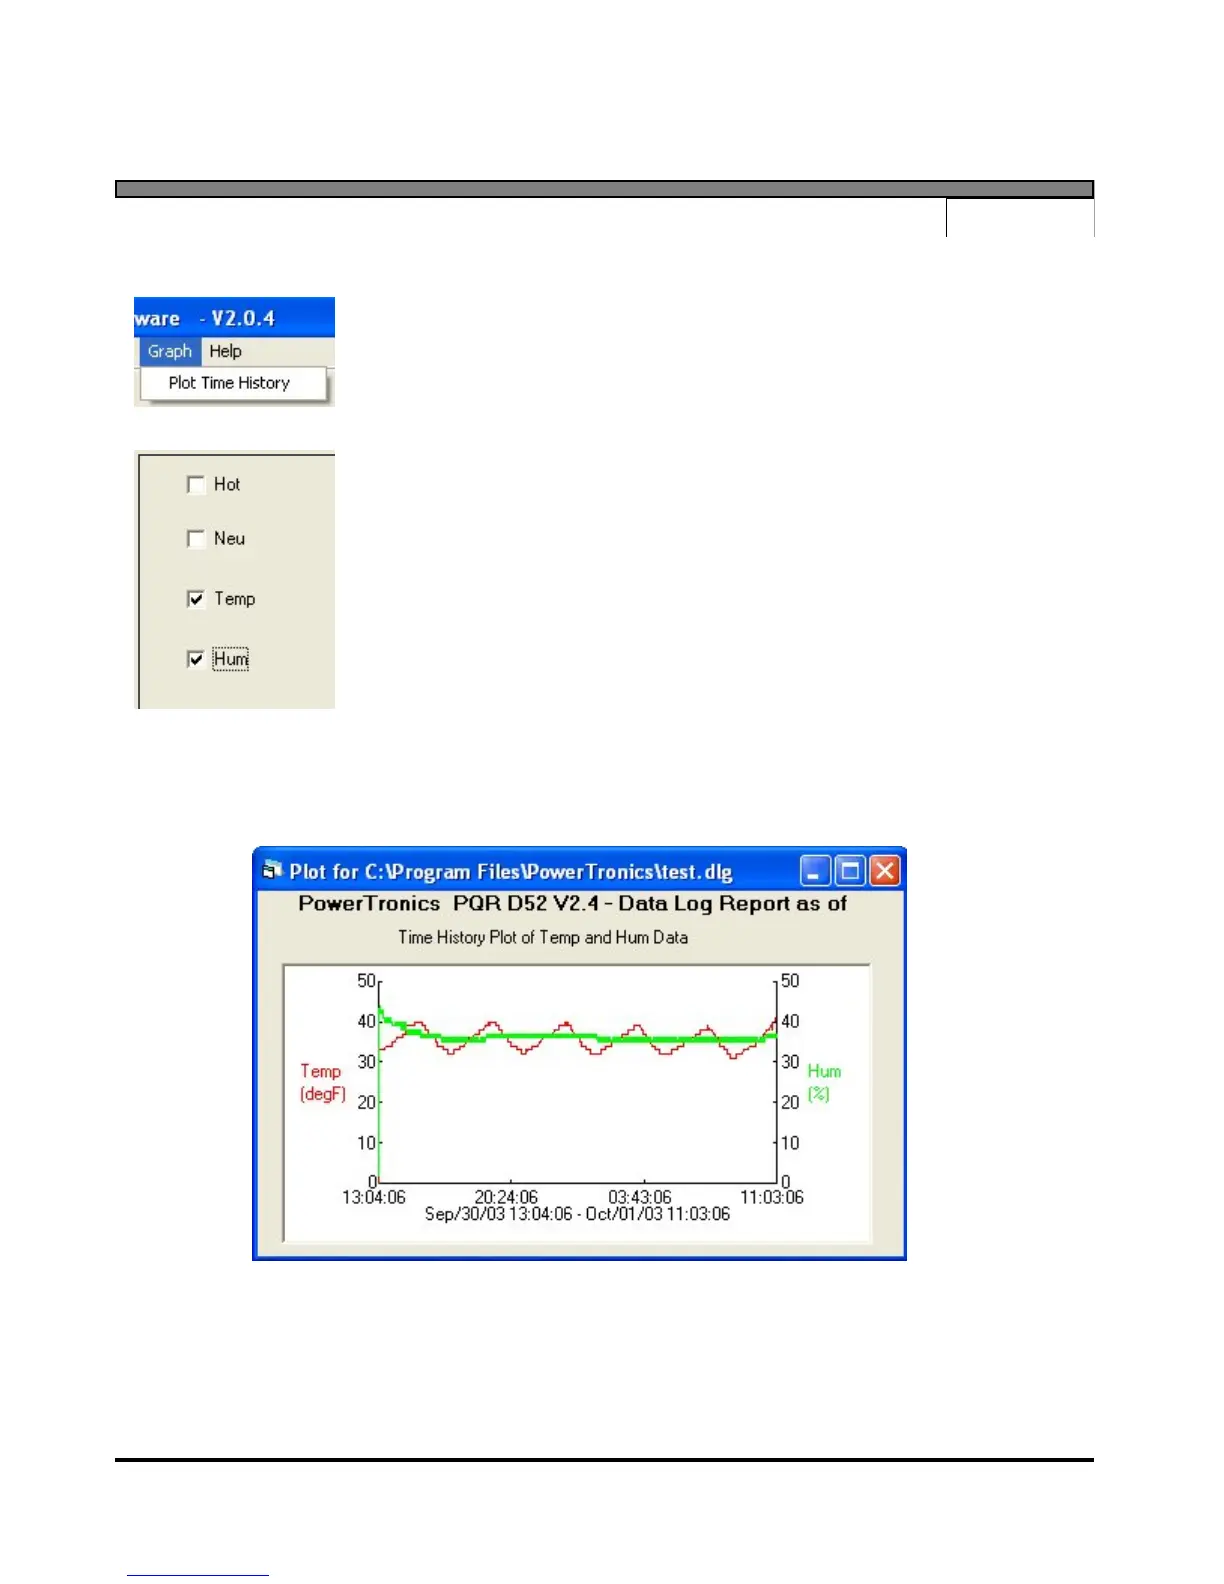
Once the channels are selected, and the Okay button is clicked, the software will scan the data
file and generate a chart showing the data in chart form.
Data Log chart of Temperature and Humidity
 Loading...