PQR
Series Model D52
Page 23
www.Powertronics.com
V2.1
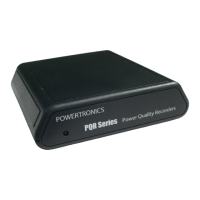
This is the chart generated
from a days worth of data
logging on a 120V AC
Line.
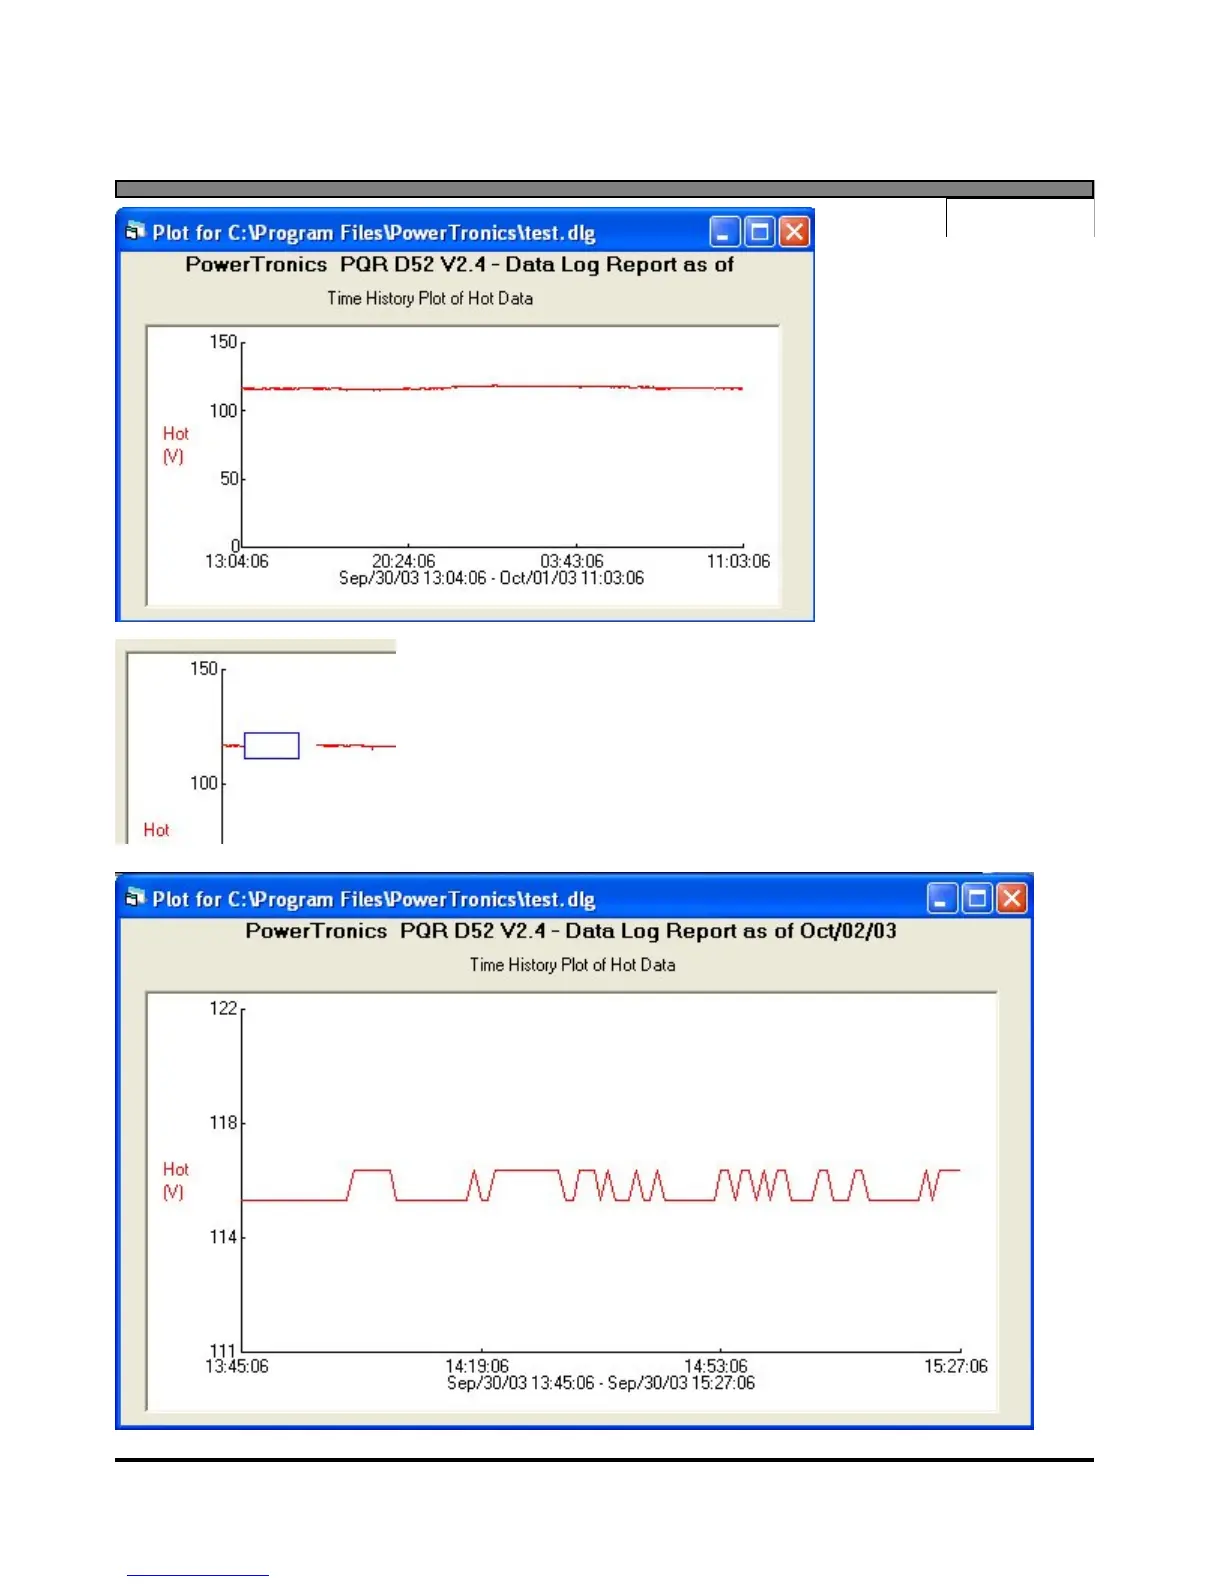
By holding down your Left Mouse Button you create a
selection box. You can drag your mouse, and create a ZOOM
Area around your data. When you release the mouse button,
the data in the ZOOM area is expanded to fill the screen area.
Double clicking on the chart will return it to original size.
 Loading...