22
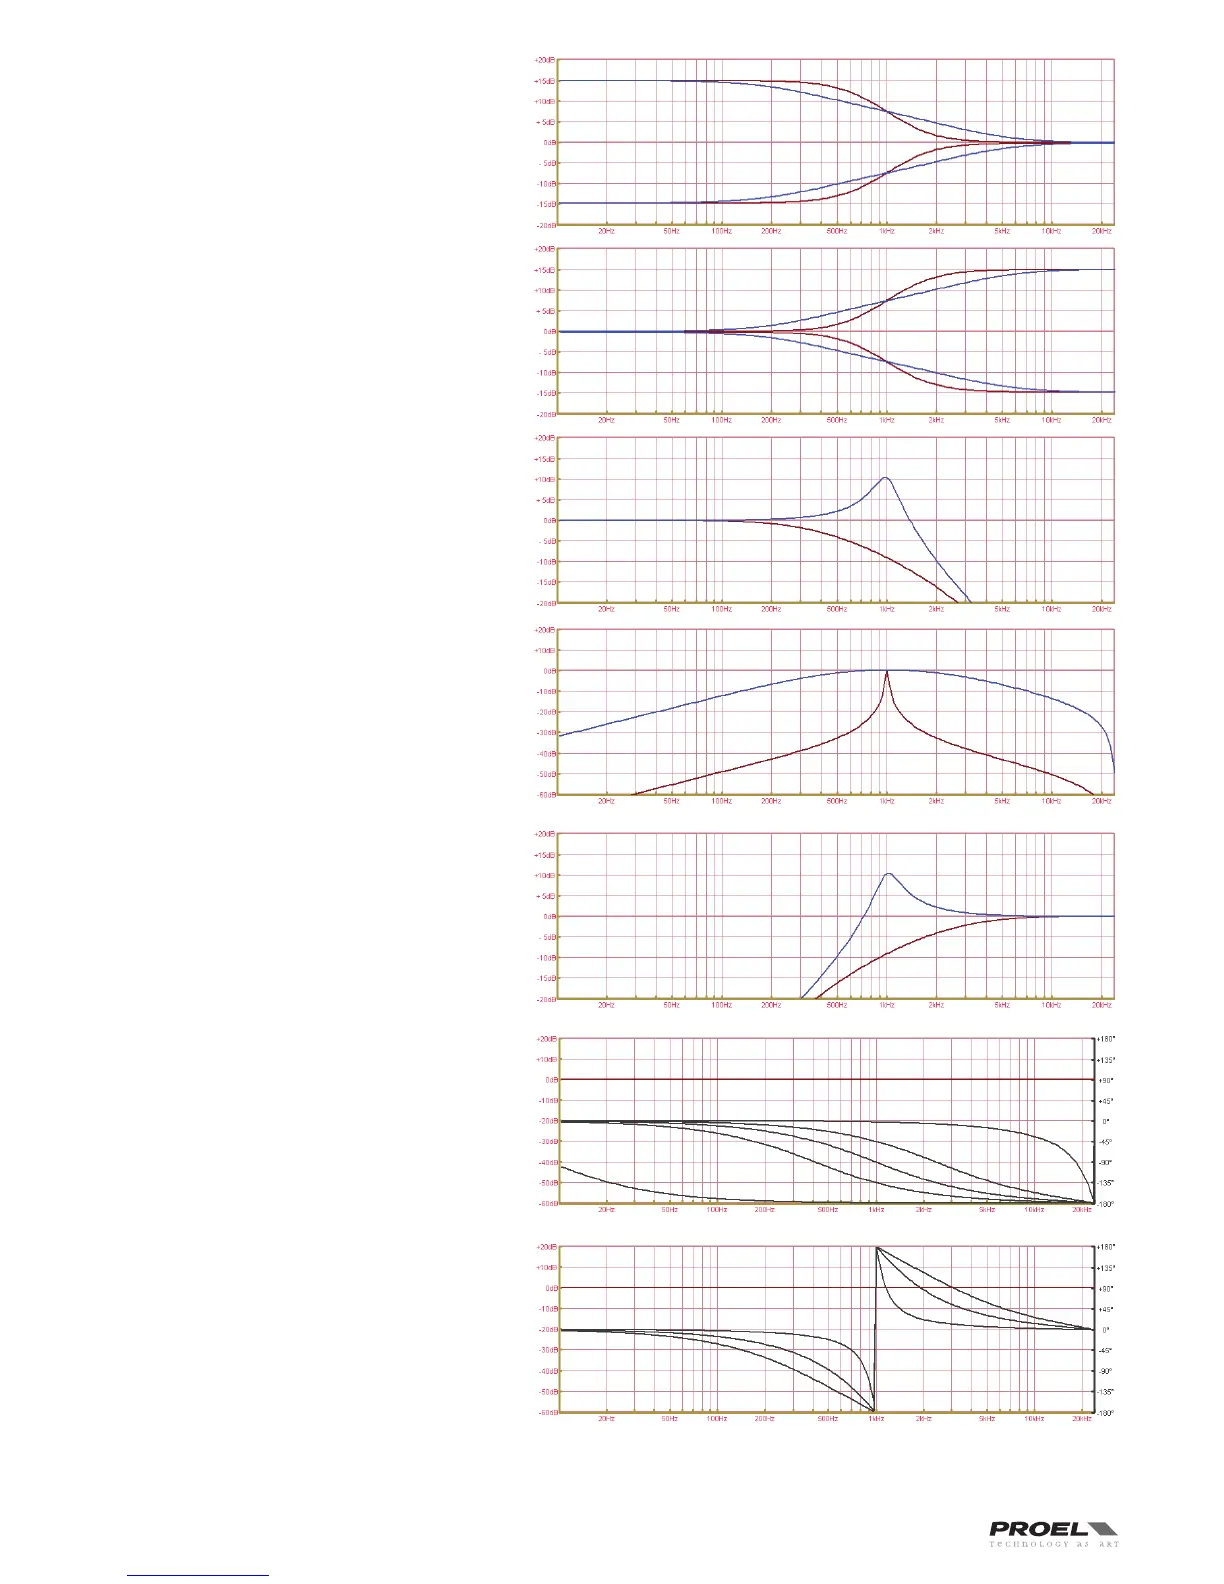
Low-shelf. A shelf filter has three parameters that
determine the frequency response: frequency, gain
and slope. In a Low-shelf filter the frequencies
below its frequency setting can be boosted or cut.
The extent of width of the filter’s transition band is
the Slope, it can be fixed at 6 or 12dB or vary in this
range. The graph shows the response at 1KHz, +15dB
or -15dB, 6 or 12 dB slope.
High-shelf. A shelf filter has three parameters that
determine the frequency response: frequency, gain
and slope. In a High-shelf filter the frequencies
above its frequency setting can be boosted or cut.
The extent of width of the filter’s transition band is
the Slope, it can be fixed at 6 or 12dB or vary in this
range. The graph shows the response at 1KHz, +15dB
or -15dB, 6 or 12 dB slope.
Res Low pass. A resonance low pass filter has two
parameters: frequency and Q. This is a low pass
filter with 12dB slope and it can be used alone or in
conjuction with a xover filter using the variable Q to
model the response in the cut off frequency range.
The graph shows the response at 1KHz, Q at min or
max value.
Bandpass. A bandpass filter has two parameters:
frequency and Q. This is a typical band pass
filter with 6dB slope. Note that the response is
fundamentally NOT a flat-topped response (so it is
not constructed from a high pass and low pass). The
graph shows the response at 1KHz, Q at min or max
value.
Res High pass. A resonance high pass filter has two
parameters: frequency and Q. This is a high pass
filter with 12dB slope and it can be used alone or in
conjuction with a xover filter using the variable Q to
model the response in the cut off frequency range.
The graph shows the response at 1KHz, Q at min or
max value.
All pass 1st. An all pass first order filter introduces a
phase shift that gradually changes from -180° above
the centre frequency to the specificed value at the
centre frequency tending towards 0° below the
centre frequency. This filter can be used to shape
the phase behaviuor of a specified output. The graph
shows the phase response centered at 1KHz at 45°
steps.
All pass 2nd. An all pass second order filter affects
the frequency at which the phase effectively flips
180° and the ‘speed’ (using the Q parameter) at
which this transition occurs. This filter can be used
to shape the phase behavior of a specified output.
The graph shows the phase response centered at
1KHz with 0.35, 0.70, 3.05 Q steps.
The following table details the type of filters that can be selected for each of the PEQ’s 5 bands and their parameters: