EasyManuals Logo

PSI FluorPen FP 100 User Manual

PSI FluorPen FP 100
50 pages
To Next Page IconTo Next Page
To Previous Page IconTo Previous Page
Page #31 background imageLoading...
Page #31 background image
31
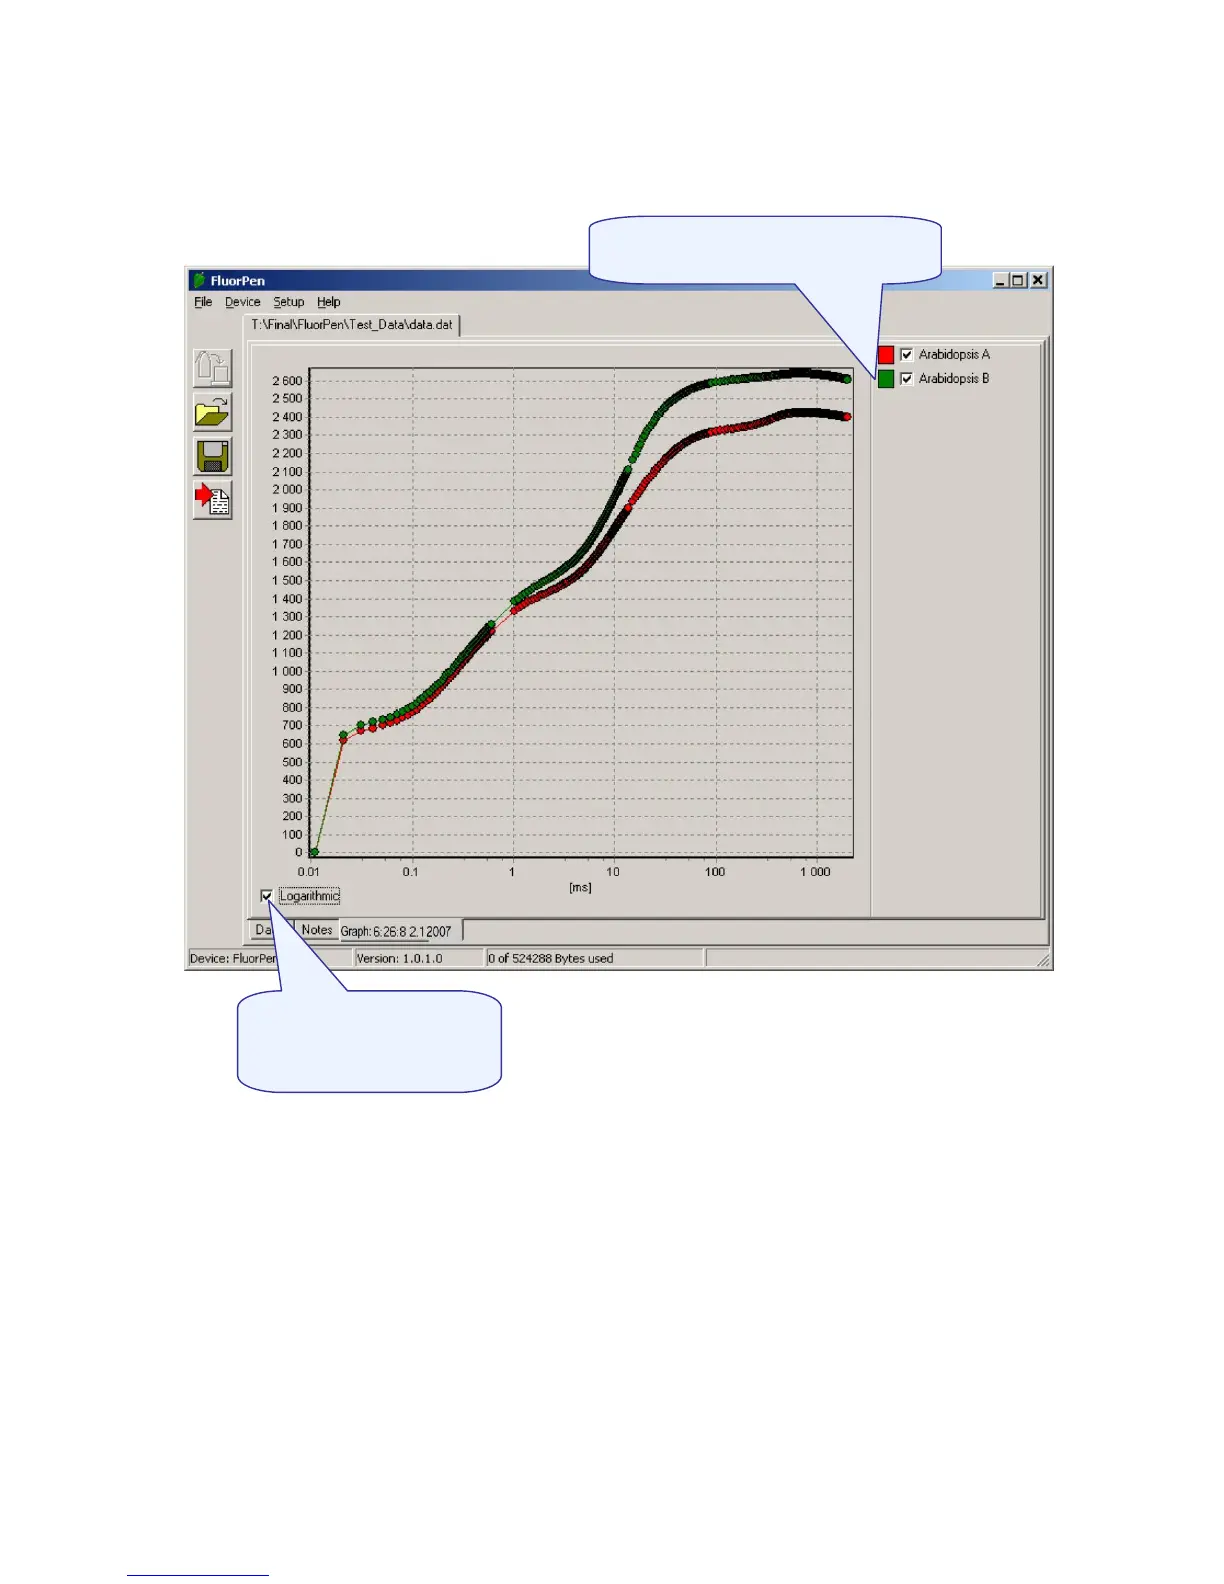
Step 4: To visualize measurement in the graphic mode, click the “Graph” field in the bottom bar.
Step 5: The colored Graph of measured data appears.
Step 6: For export press File>Export or “Export” icon, select what you want to export (Ft, QY, Measuring
by protocol). Measuring by protocol export all protocols at once (OJIP, NPQ, LC...).
Selected only - exports only one measurement that is selected by mouse, otherwise it will export
everything.
Source data - exports raw data, in case of OJIP: points of the curve
Computed values - export calculated data, in case of OJIP: Fo, Fi, Fj...
Description - exports the data description if any
Selection of data corresponds to
their description
Choose logarithmic or
non-logarithmic graph
form

Questions and Answers:

Question and Answer IconNeed help?

Do you have a question about the PSI FluorPen FP 100 and is the answer not in the manual?

PSI FluorPen FP 100 Specifications

General IconGeneral
BrandPSI
ModelFluorPen FP 100
CategoryMeasuring Instruments
LanguageEnglish

Related product manuals