16 pulsar 3
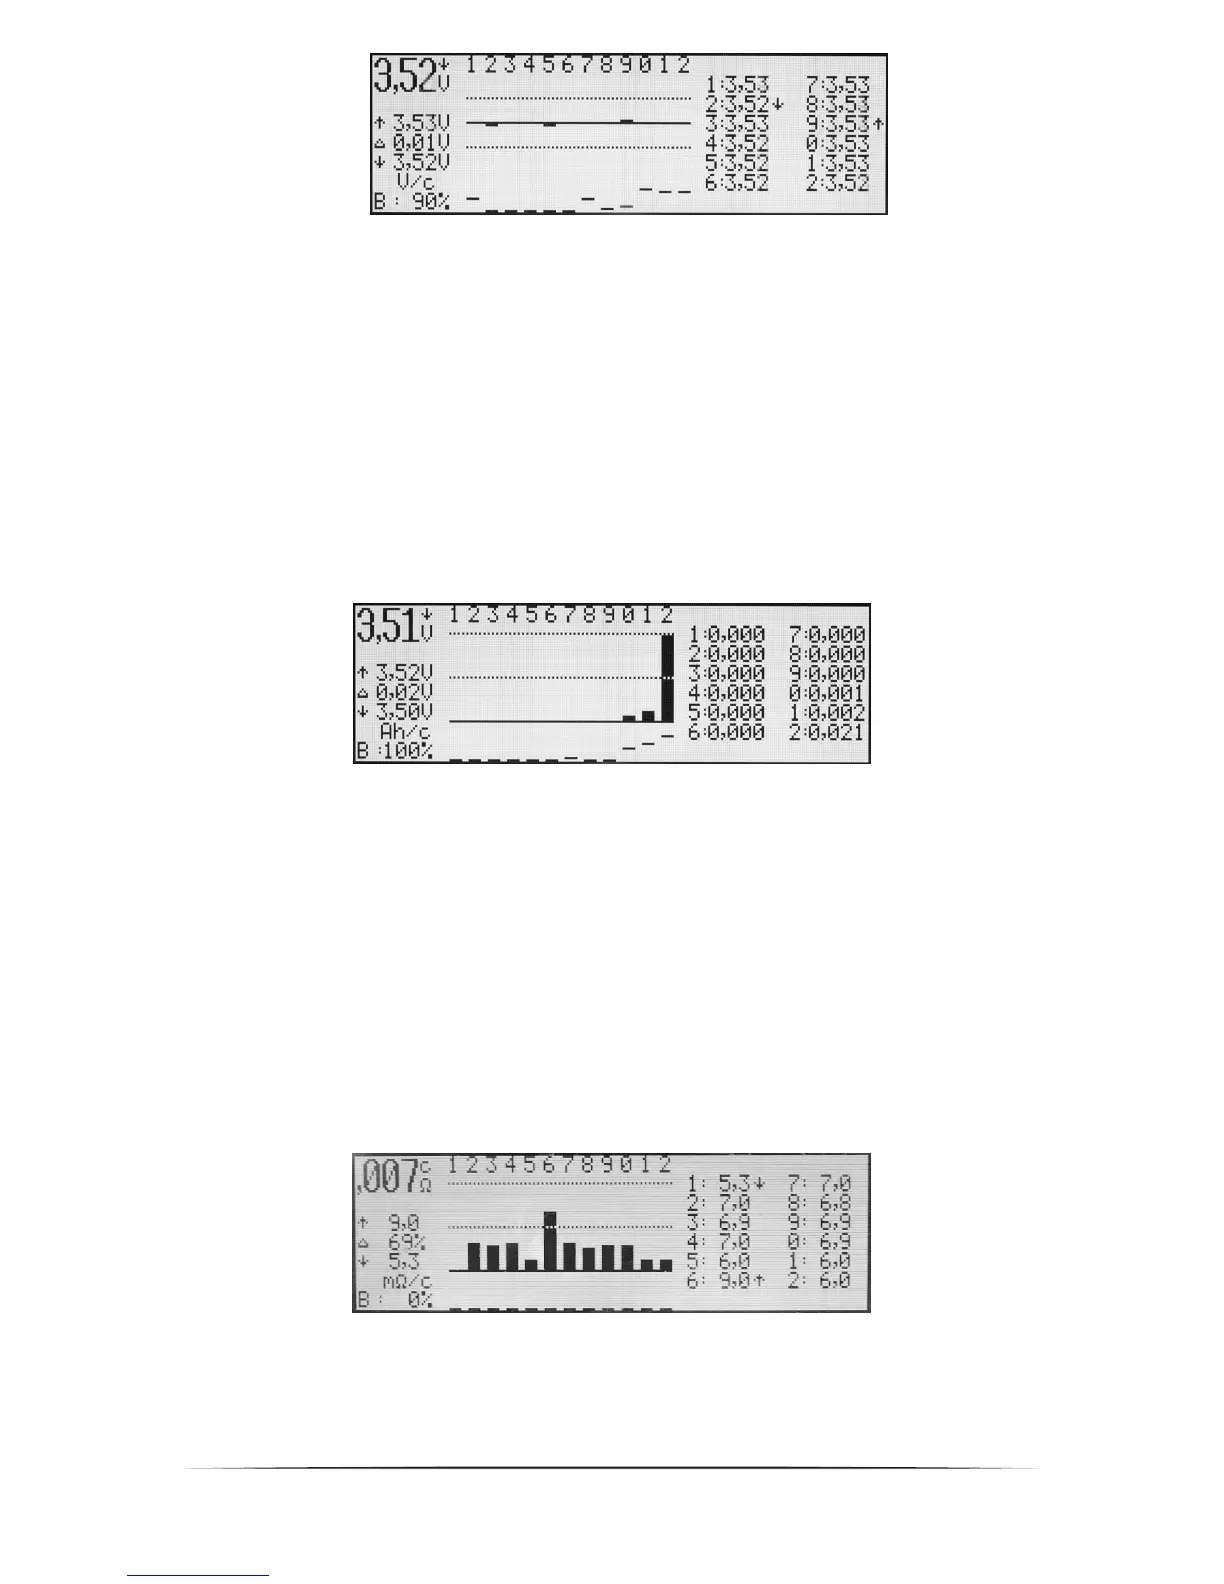
Cells’ voltage (V/c) window contains the following information:
1. 3,52V – average voltage of all cells in the package (V/cell)
2. ↓ – voltage change tendency marker displayed above “V” (Volt)
3. Row of numbers – singular package cells’ numbering starting from the first, plugged into the package’s
“minus” cable
4. ↑ 3,53V – voltage of the strongest cell in the package (here cell nr. 9)
5. Δ 0,01V – difference in voltage between the strongest and the weakest cell (10mV in this example).
6. ↓ 3,52V – voltage of the weakest cell in the package (here cell nr. 2)
7. V/c – cell’s voltage window – one of the two windows of the balancer
8. B: 90% – current balancer power (90% max. power of the balancer)
9. Upper dotted line –+0,05V voltage in proportion to average package value
10. Middle dotted line – average package voltage
11. Lower dotted line – -0,05V voltage in proportion to average package value
12. Singular bottom lines – balancer power level (cingular channel). The higher the line, the higher the
balancing power of that cell is.
13. Singular voltages (on the right) – the cells with the highest and the lowest voltage are marked with the
appropriate arrow (here cells 9 and 2)
Equalized package capacity window (Ah/c) contains the following information:
1. 3,51V – (above „V”) – average voltage of all cells in the package (V/cell)
2. ↓ – voltage change tendency marker displayed above “V” (Volt)
3. Row of numbers – singular package cells’ numbering starting from the first, plugged into the package’s
“minus” cable
4. ↑ 3,52V – voltage of the strongest cell in the package
5. Δ 0,02V – voltage difference between the strongest and the weakest cell In the package (here 0.02V)
6. ↓ 3,50V – voltage of the strongest cell in the package
7. Ah/c – ampere-hour window per cell – one of the two balancer windows
8. B: 100% – current balancer power (100% max. balancer power)
9. Upper dotted line – 100% equalized capacity
10. Middle dotted line – 50% equalized capacity
11. Bars – equalized capacities in bar graphics. The highest bar shows the cell (here cell 12), which required
the greatest balancing (100%)
12. Singular bottom lines – balancer power level (cingular channel). The higher the line, the higher the
balancing power of that cell is.
13. Equalize capacity – in ampere-hour per one cell )here in cell 12 = 0,021Ah)
The display (inner resistance of cells mΩ/c) shows following information:
1. ,007 Ω/c = Sum of resistances of single cells alternating with middle inner resistance of all cells (Ω/cell)
2. ↑ 9,0 mΩ = Resistance of the cell with the highest value within the battery pack (cell 6 in this
case)