Q150T Sample Preparation System
Q150T - Instruction Manual 53 10473 - Issue 5
6.6.3 Network Troubleshooting
If the connection fails, check that the first three numbers in the IP addresses of the
instrument and the computer are the same. Check the firewall settings.
The Q150 will only support one connection. For example, it will not allow simultaneous
connections to Internet Explorer and Windows Explorer.
6.7 Process Logging
To view the process log, listing the profiles run on the Q150T:
1. With the system at the Standby screen (see Figure 3-1), tap on Service.
2. From the displayed Service menu, tap on Process Log.
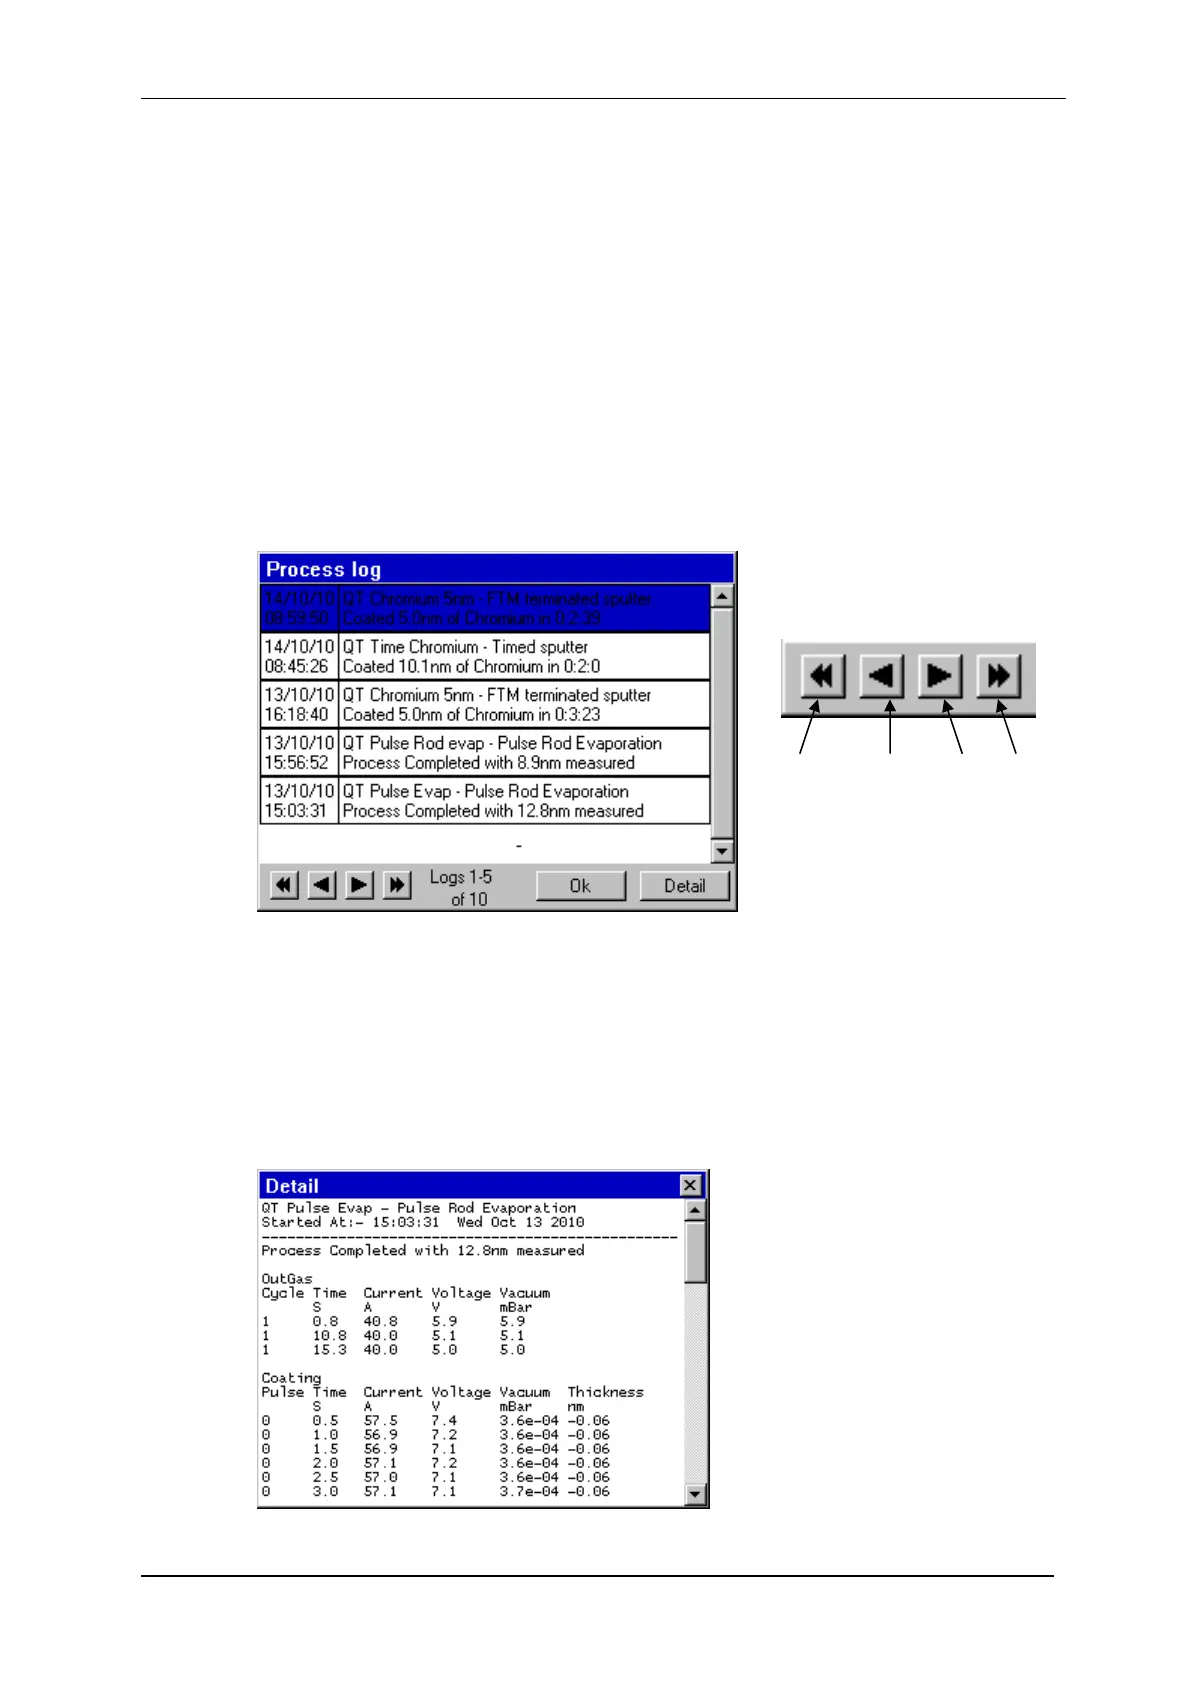
3. The process log is displayed (see Figure 6-13). Process events are listed in order
with the most recent at the top of the list.
4. The log displays five events on each page. To browse through the list, use the
buttons in the lower left corner to step through the list viewing other pages.
Figure 6-13. Process log and browse buttons
To view the details of a particular logged event:
1. Use the buttons to browse through the list.
2. Select the event.
3. Tap on the Details button.
Details for the logged event are displayed (see Figure 6-14). The actual data displayed
will depend on the process type. If any problems were encountered during the process,
the report will include error and warning messages.
Figure 6-14. Process log detail
First Previous Next Last
page page page page