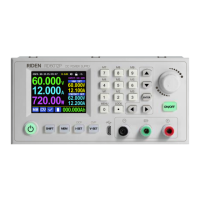
The pause symbol (two, parallel white bars with a blue background) indicates the graph is paused. When
running the graph state is shown as a white arrowhead with a red background at the same position.
The pause/run state can be toggled by pressing “ENTER” in graph mode.
(Sometimes it needs to be pressed twice).
The rate at which the graph moves is controlled by the ‘Graph Window’ setting found within the ‘Quick
Settings’ Menu. “SHIFT”+ “▼”
The fastest setting permitted is 1 minute and that implies that a set of values written at the right margin
will take 1 minute to be pushed to the left margin.
If the Graph Window setting was 1 hour then values will take 1 hour to move from the right margin to
the left margin.
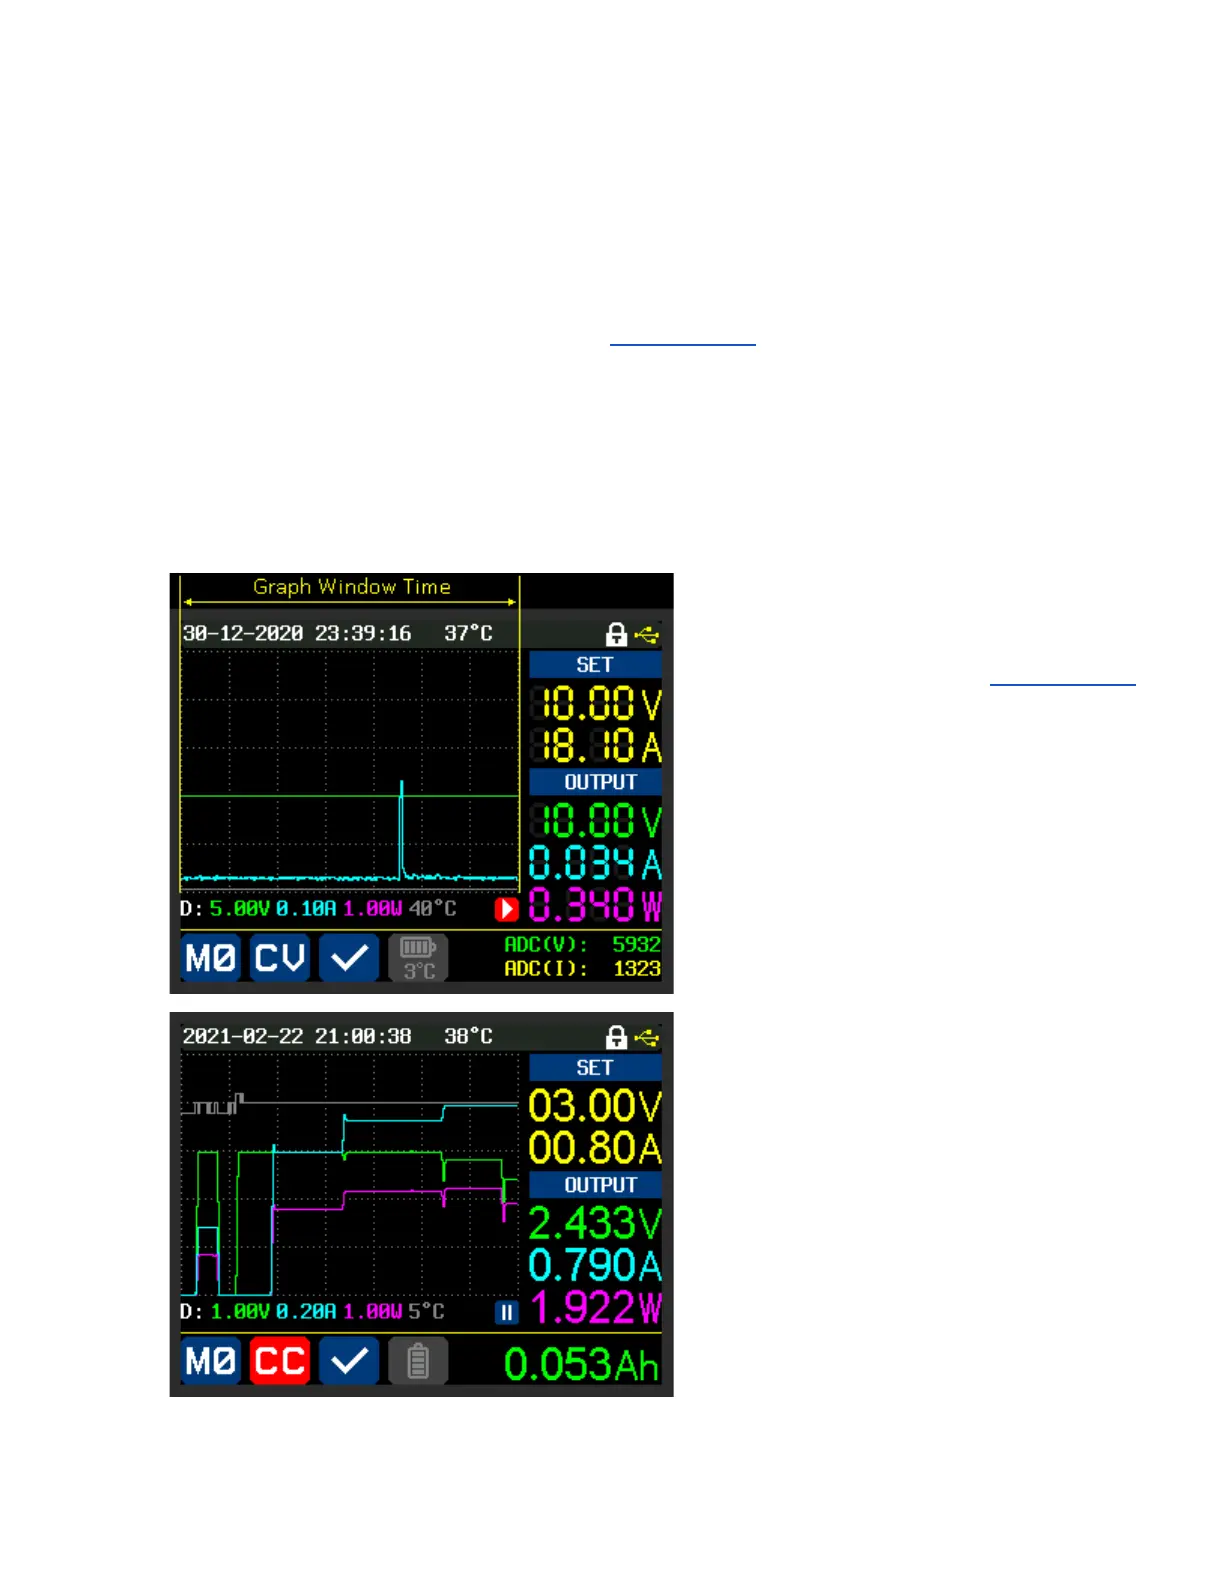
The yellow ‘Graph Window Time’, shown top
left, is what is being set in the ‘Graph Window’
setting.
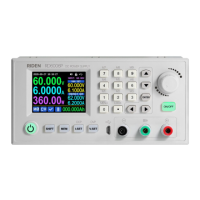
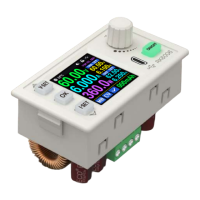
This image shows a graph of the RD60xx
driving a DC load in CR (constant resistance)
mode.
The resistance is lowered in stages
until the I-SET value is reached after
which the PS goes into CC mode.