13
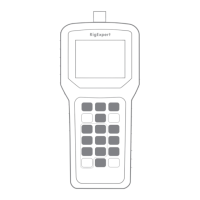
3 – detector output voltage vs. frequency graph. With no load at the antenna
connector, the display should look like shown on the picture:
AA-30 AA-54
The voltage curve should stay between the horizontal dotted lines. The vertical
lines are the bounds of analyzer’s subbands.
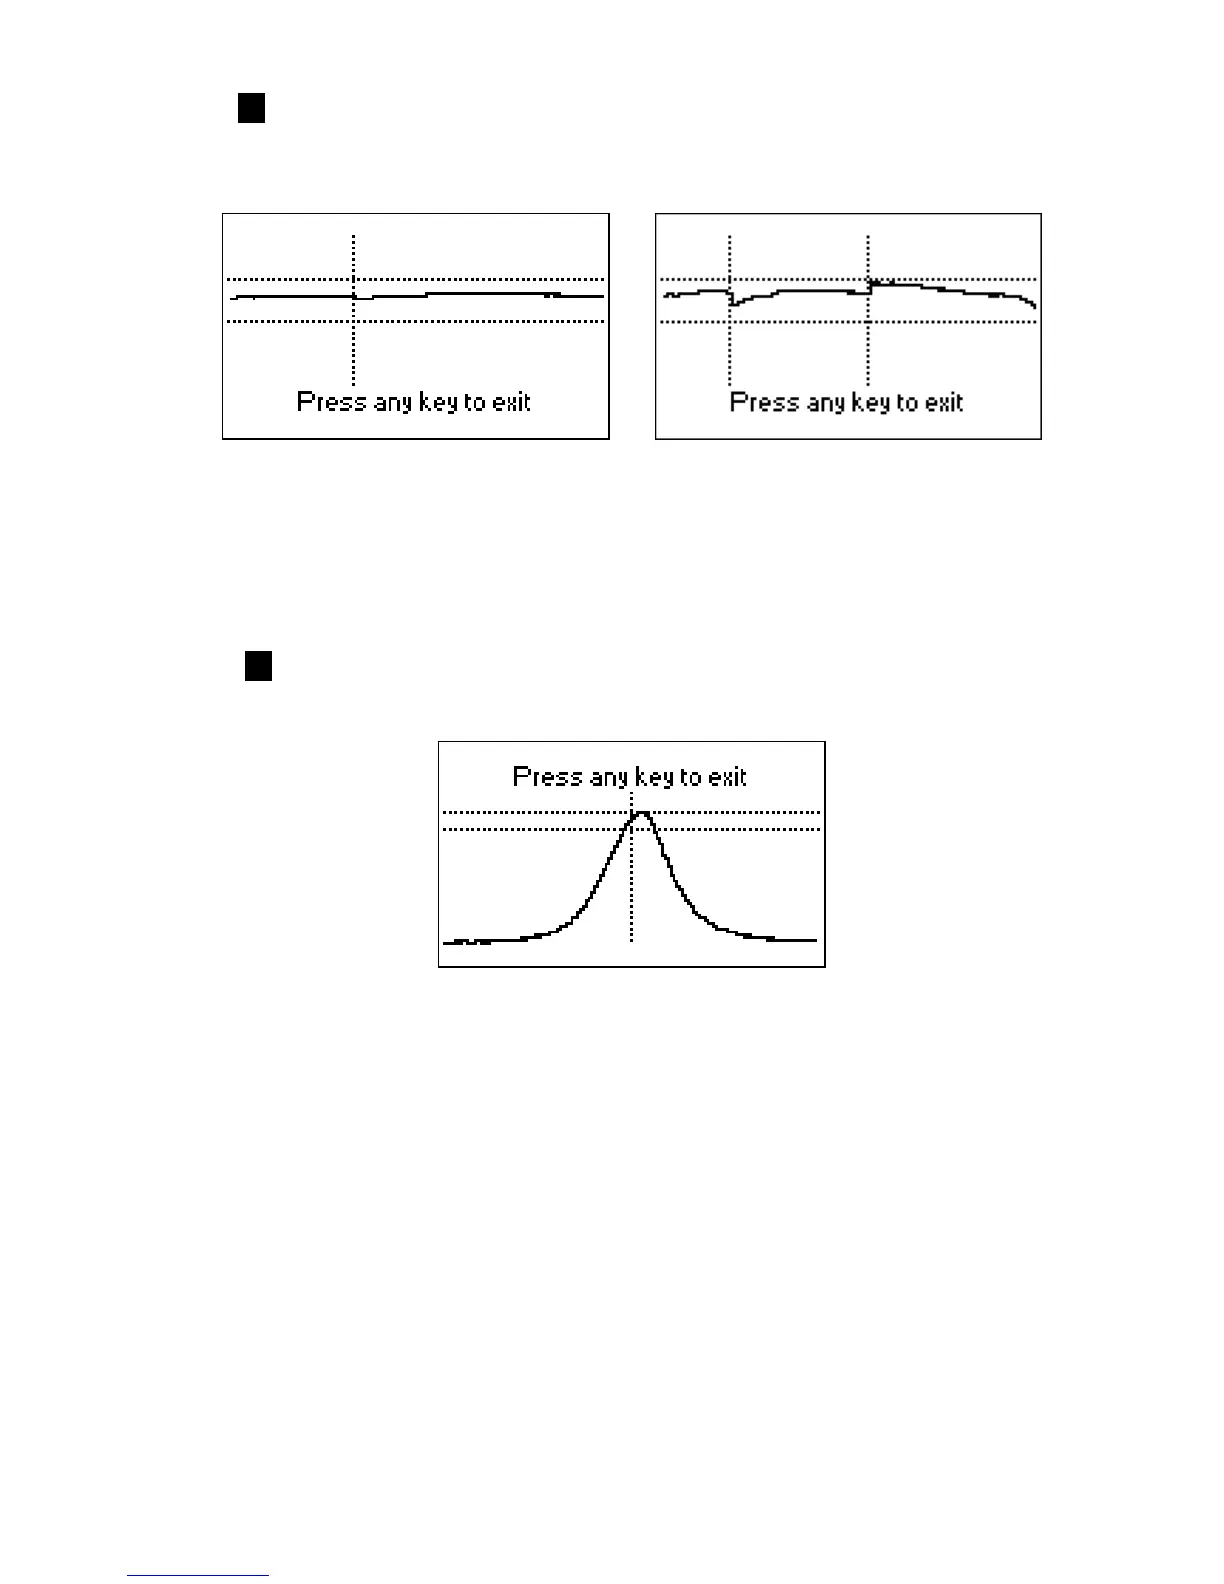
4 – bandpass filter frequency response graph. With no load at the antenna
connector, the display should look like shown on the picture:
4
The top of the curve should be located in the middle of the screen, between
the two horizontal dotted lines. A small horizontal shift of the curve is
allowed.