ARBOTOM
®
- Manual 34
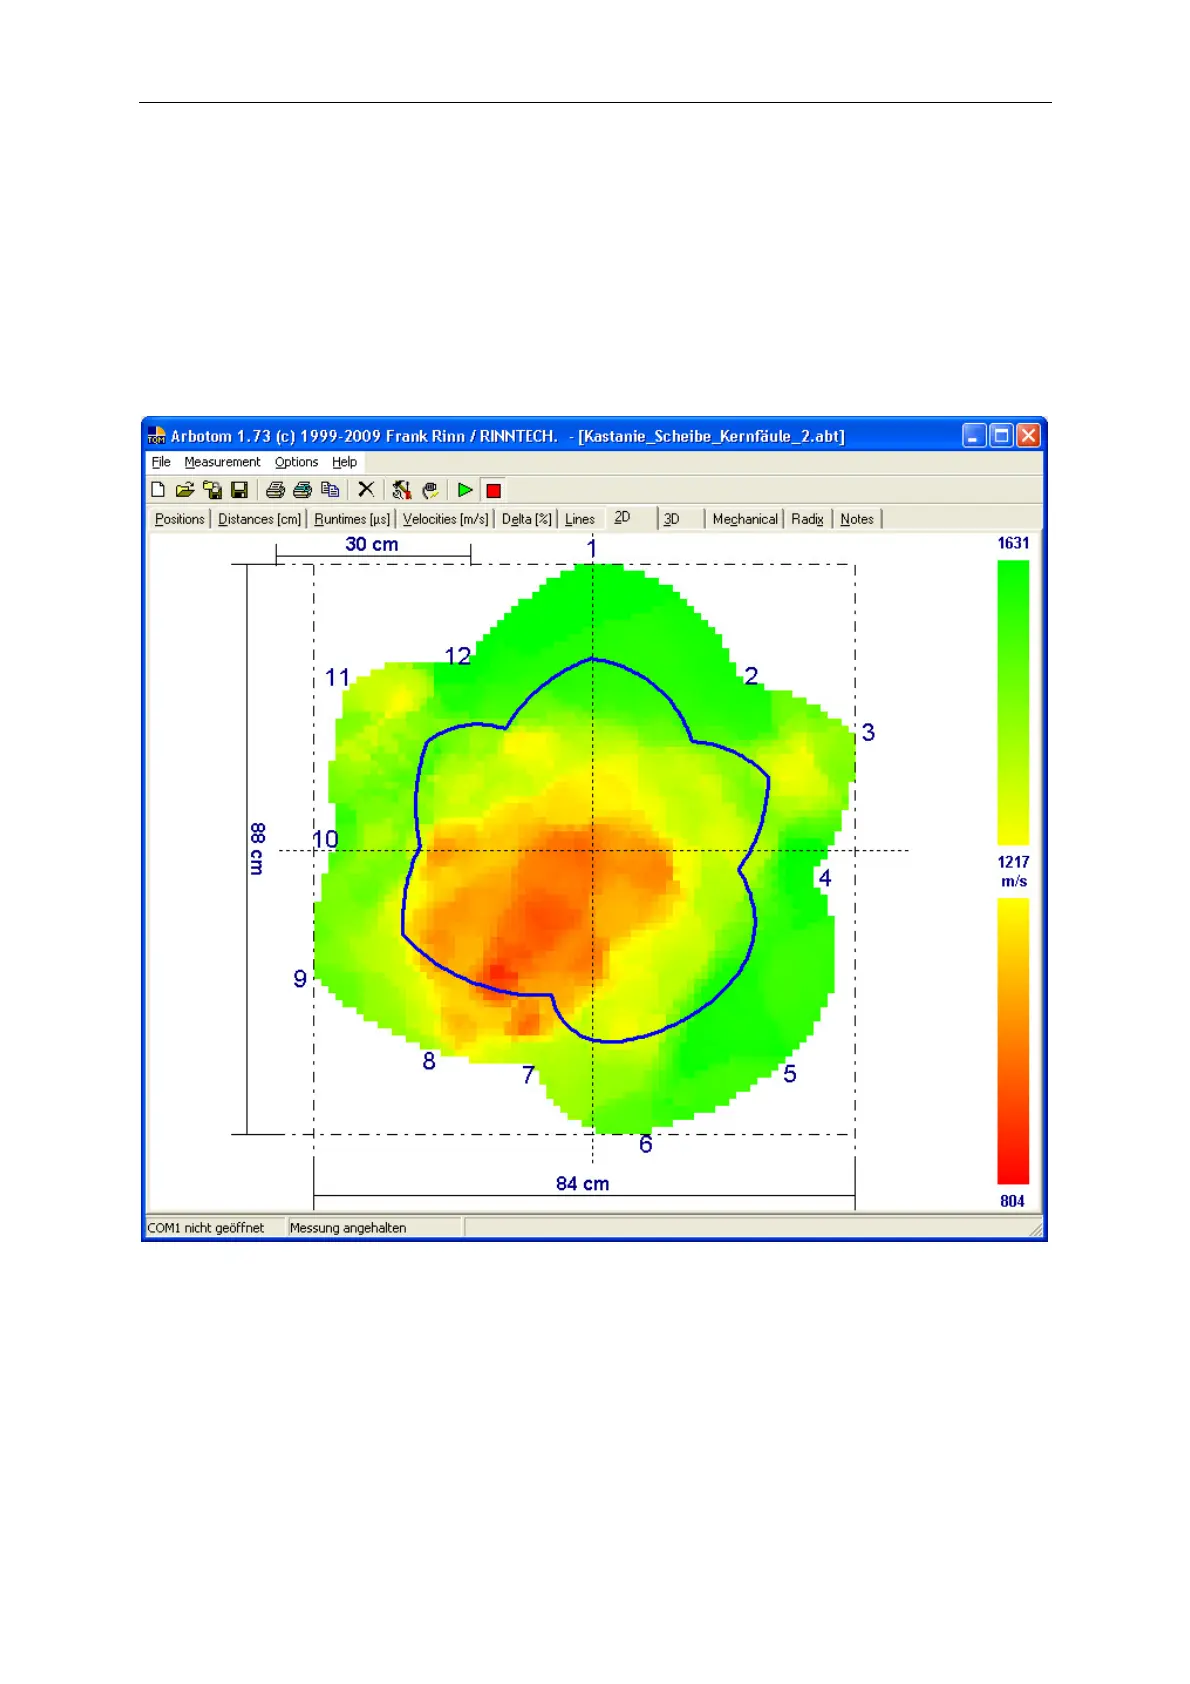
Surface graph
The surface graph is calculated from the line graph using a mathematical algorithm. Depending on the
density of the sensor network, this routine allows to localize wood defects.
As a default the color palette is scaled according to the range of velocities - from the lowest to the
highest value. You must take into consideration that this does not necessarily represents a range of
wood quality from decayed to sound wood. Therefore we recommend to adapt the range in the
“Options” manually according to the requirements of the different wood species.